Fig. 4.
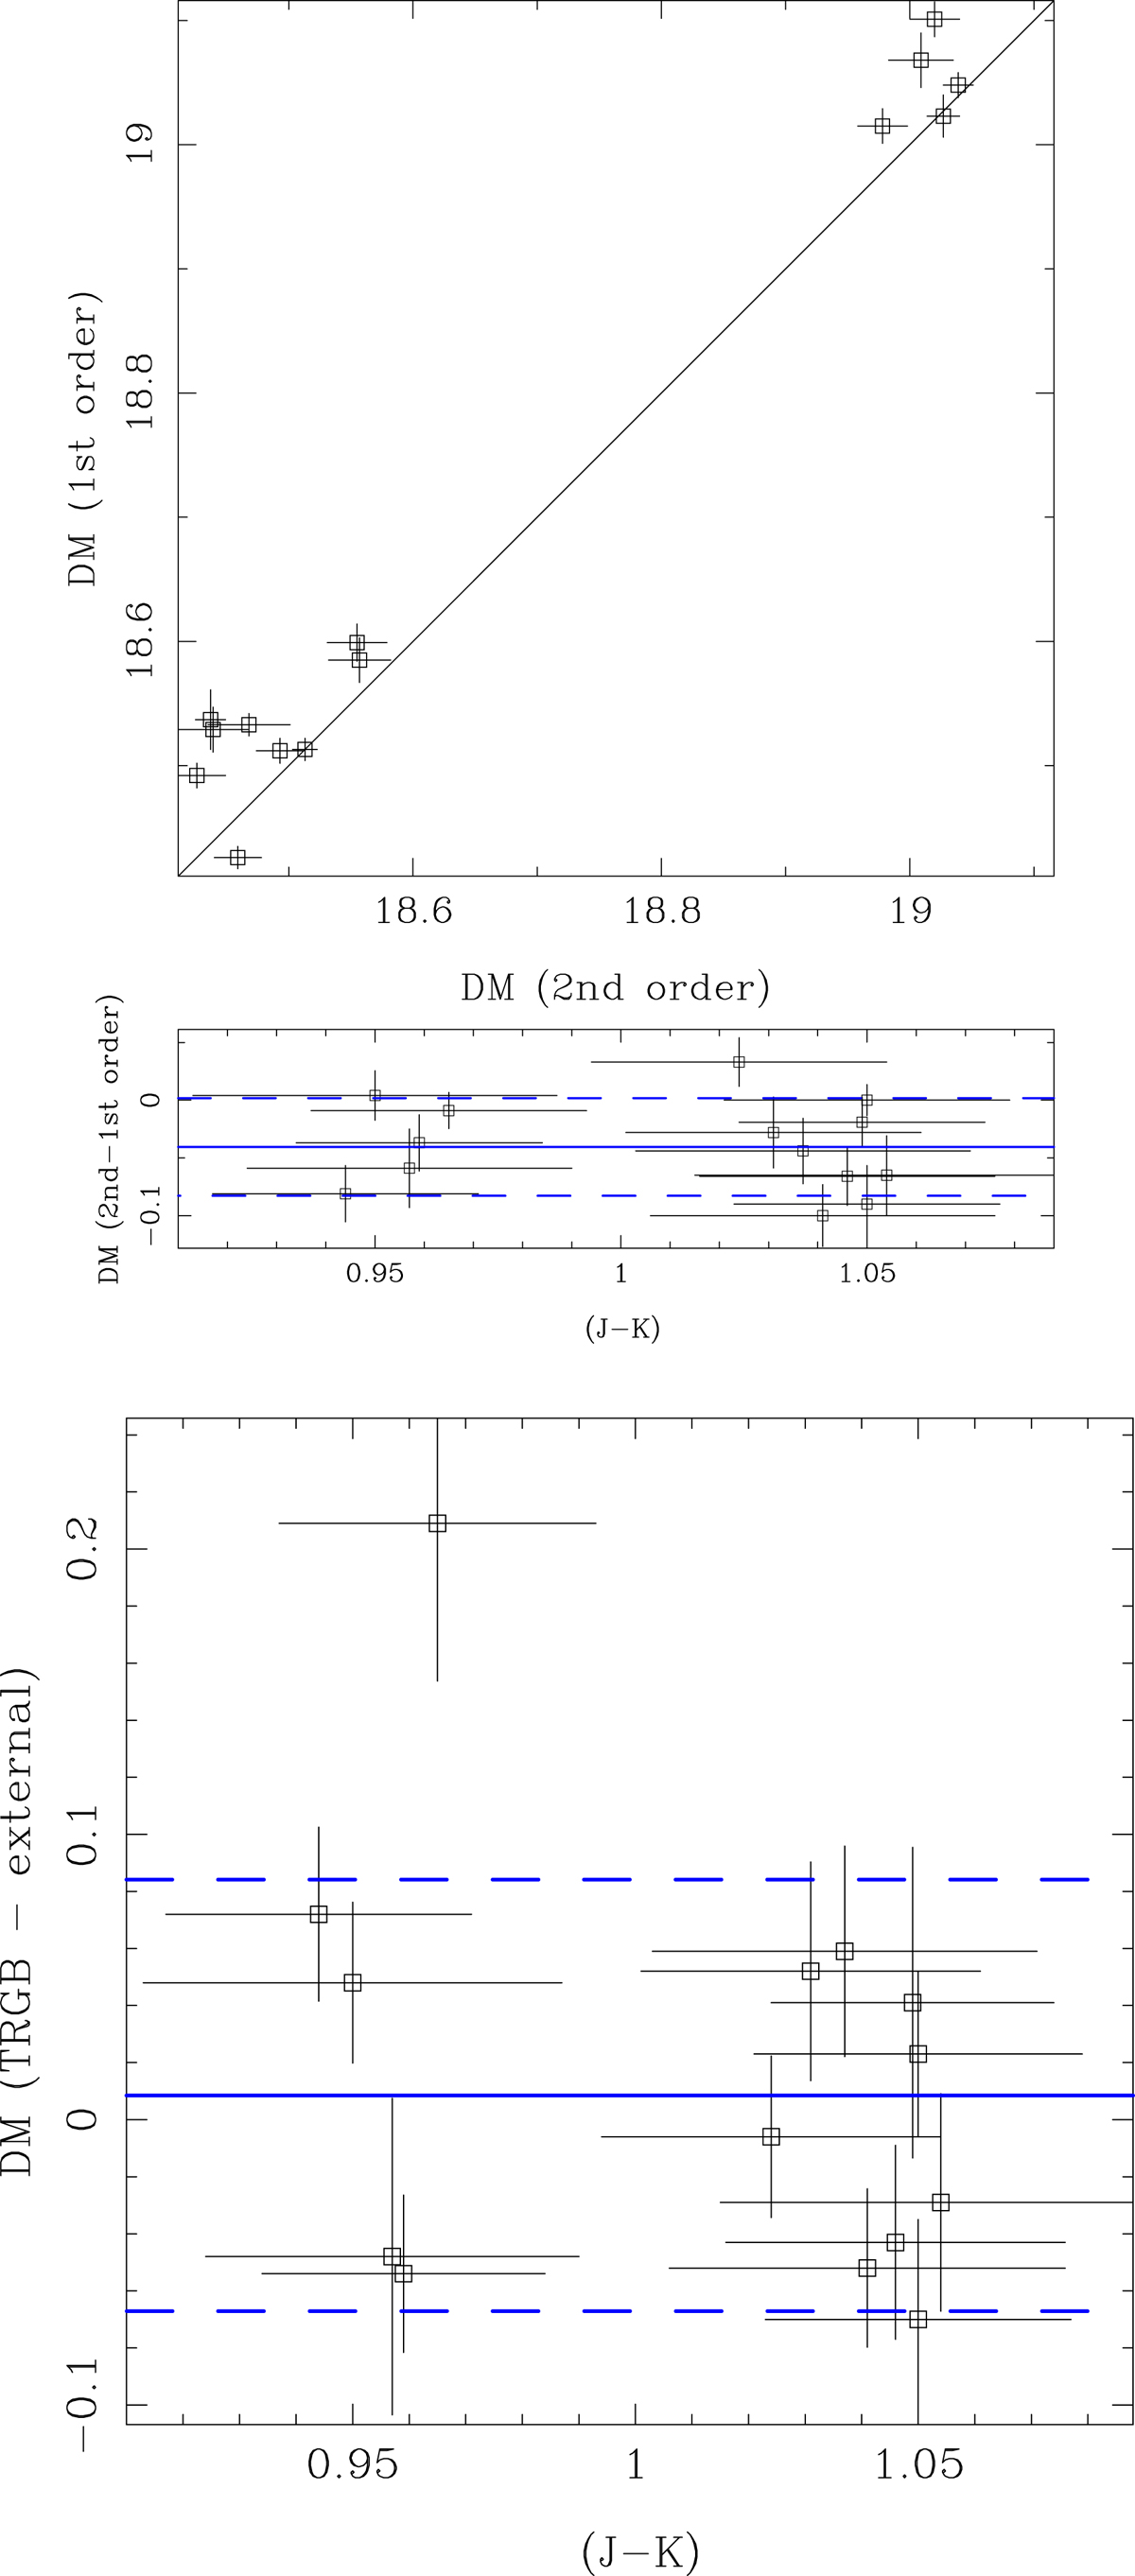
Comparison of the TRGB DM based on the first- and second-order derivatives (top panel), and the difference plotted against (J − Ks) colour (middle panel) towards the 14 los containing dEBs. The one-to-one relation is shown in the top panel. In the middle panel in blue are indicated the median of the difference (solid line) and plus-minus the dispersion (taken as 1.48 ⋅ MAD; dashed lines). The bottom panel shows the difference between the second-order-derivative-based TRGB distance and the DM of the dEB systems against colour. The median of the difference (solid line) and plus-minus 1.48 ⋅ MAD (dashed line) are shown as the blue lines.
Current usage metrics show cumulative count of Article Views (full-text article views including HTML views, PDF and ePub downloads, according to the available data) and Abstracts Views on Vision4Press platform.
Data correspond to usage on the plateform after 2015. The current usage metrics is available 48-96 hours after online publication and is updated daily on week days.
Initial download of the metrics may take a while.