Free Access
Fig. A.12.
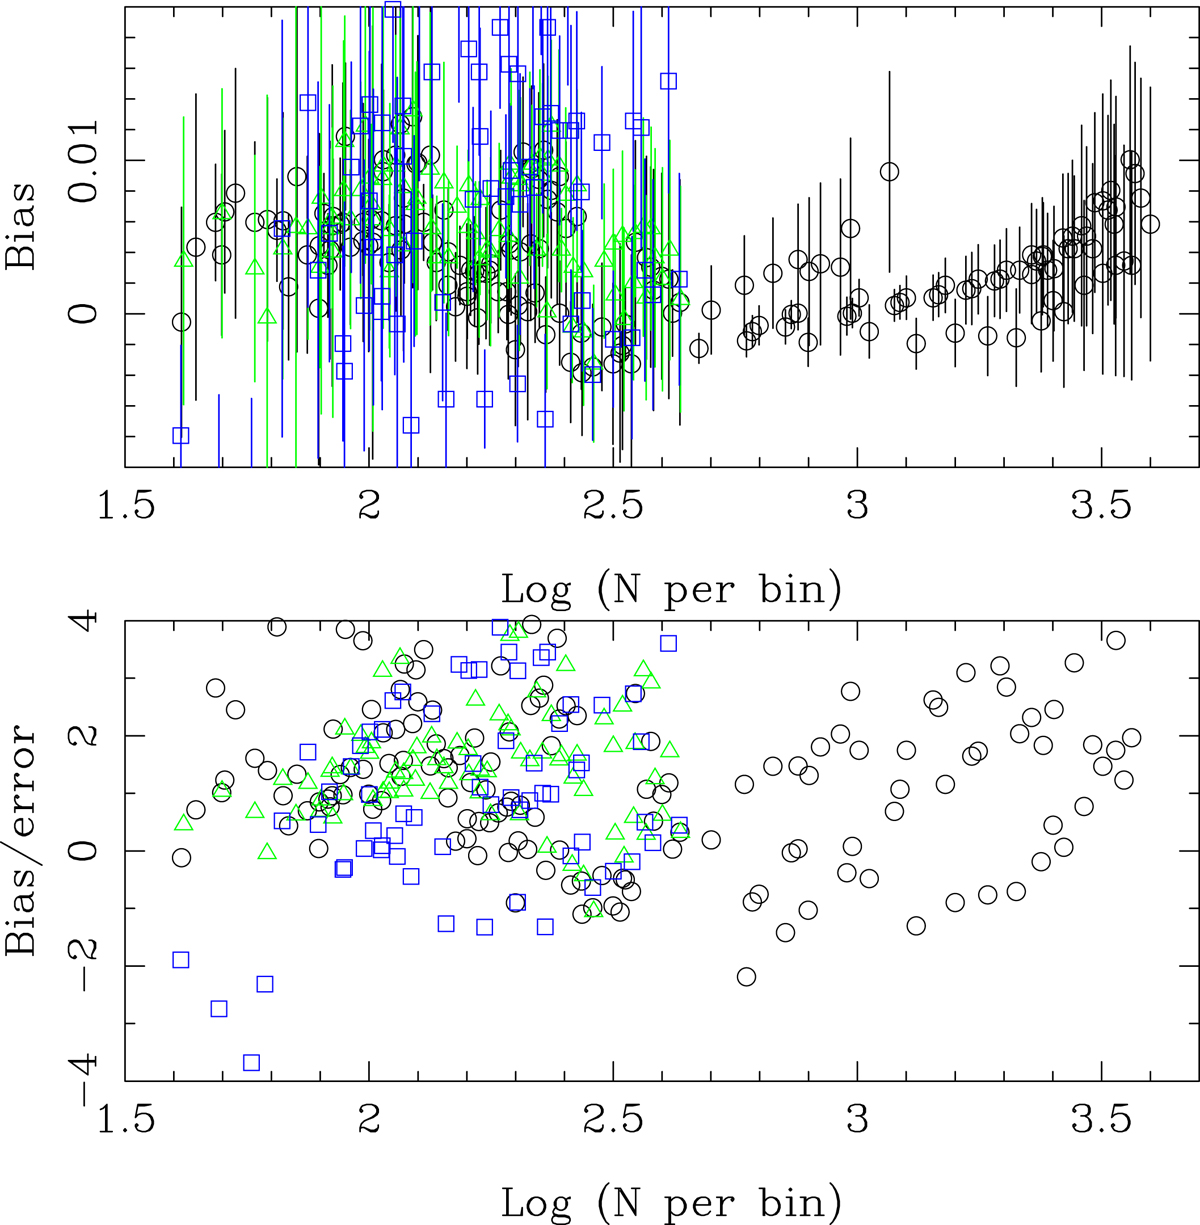
Diagnostic plots for the SG-filter. Final selection, with all non-red points from Fig. A.11 plotted on a smaller scale (−0.01 to +0.02 mag). Scale height colour coded as in Fig. A.9. The bottom panel shows the bias divided by the error bar. Larger simulations have only been run for the smallest scale height.
Current usage metrics show cumulative count of Article Views (full-text article views including HTML views, PDF and ePub downloads, according to the available data) and Abstracts Views on Vision4Press platform.
Data correspond to usage on the plateform after 2015. The current usage metrics is available 48-96 hours after online publication and is updated daily on week days.
Initial download of the metrics may take a while.