Fig. A.8.
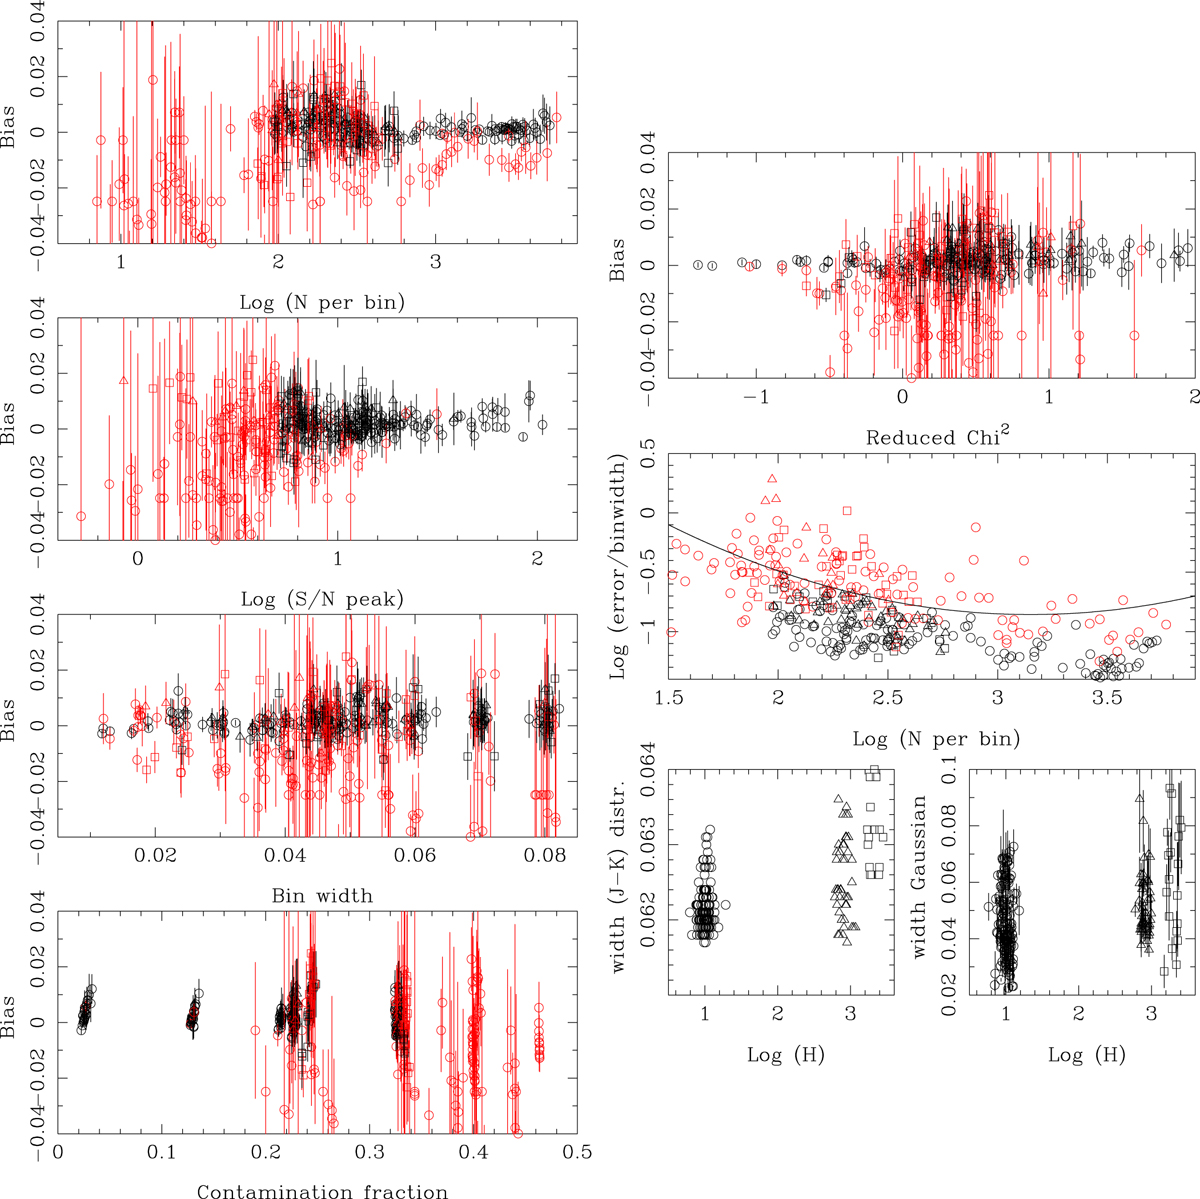
Diagnostic plots for the DG-filter. Final selection where red means excluded models with: Number of RGB stars per bin < 85, or S/N of the peak < 5, or bin width > 0.085, or a contamination fraction > 0.38, or an (error / bin width) above the curve, given by y = 0.2778 ⋅ x2 − 1.75 ⋅ x + 1.90, where x = log(N per bin) and y = log (error / bin width).
Current usage metrics show cumulative count of Article Views (full-text article views including HTML views, PDF and ePub downloads, according to the available data) and Abstracts Views on Vision4Press platform.
Data correspond to usage on the plateform after 2015. The current usage metrics is available 48-96 hours after online publication and is updated daily on week days.
Initial download of the metrics may take a while.