Fig. A.6.
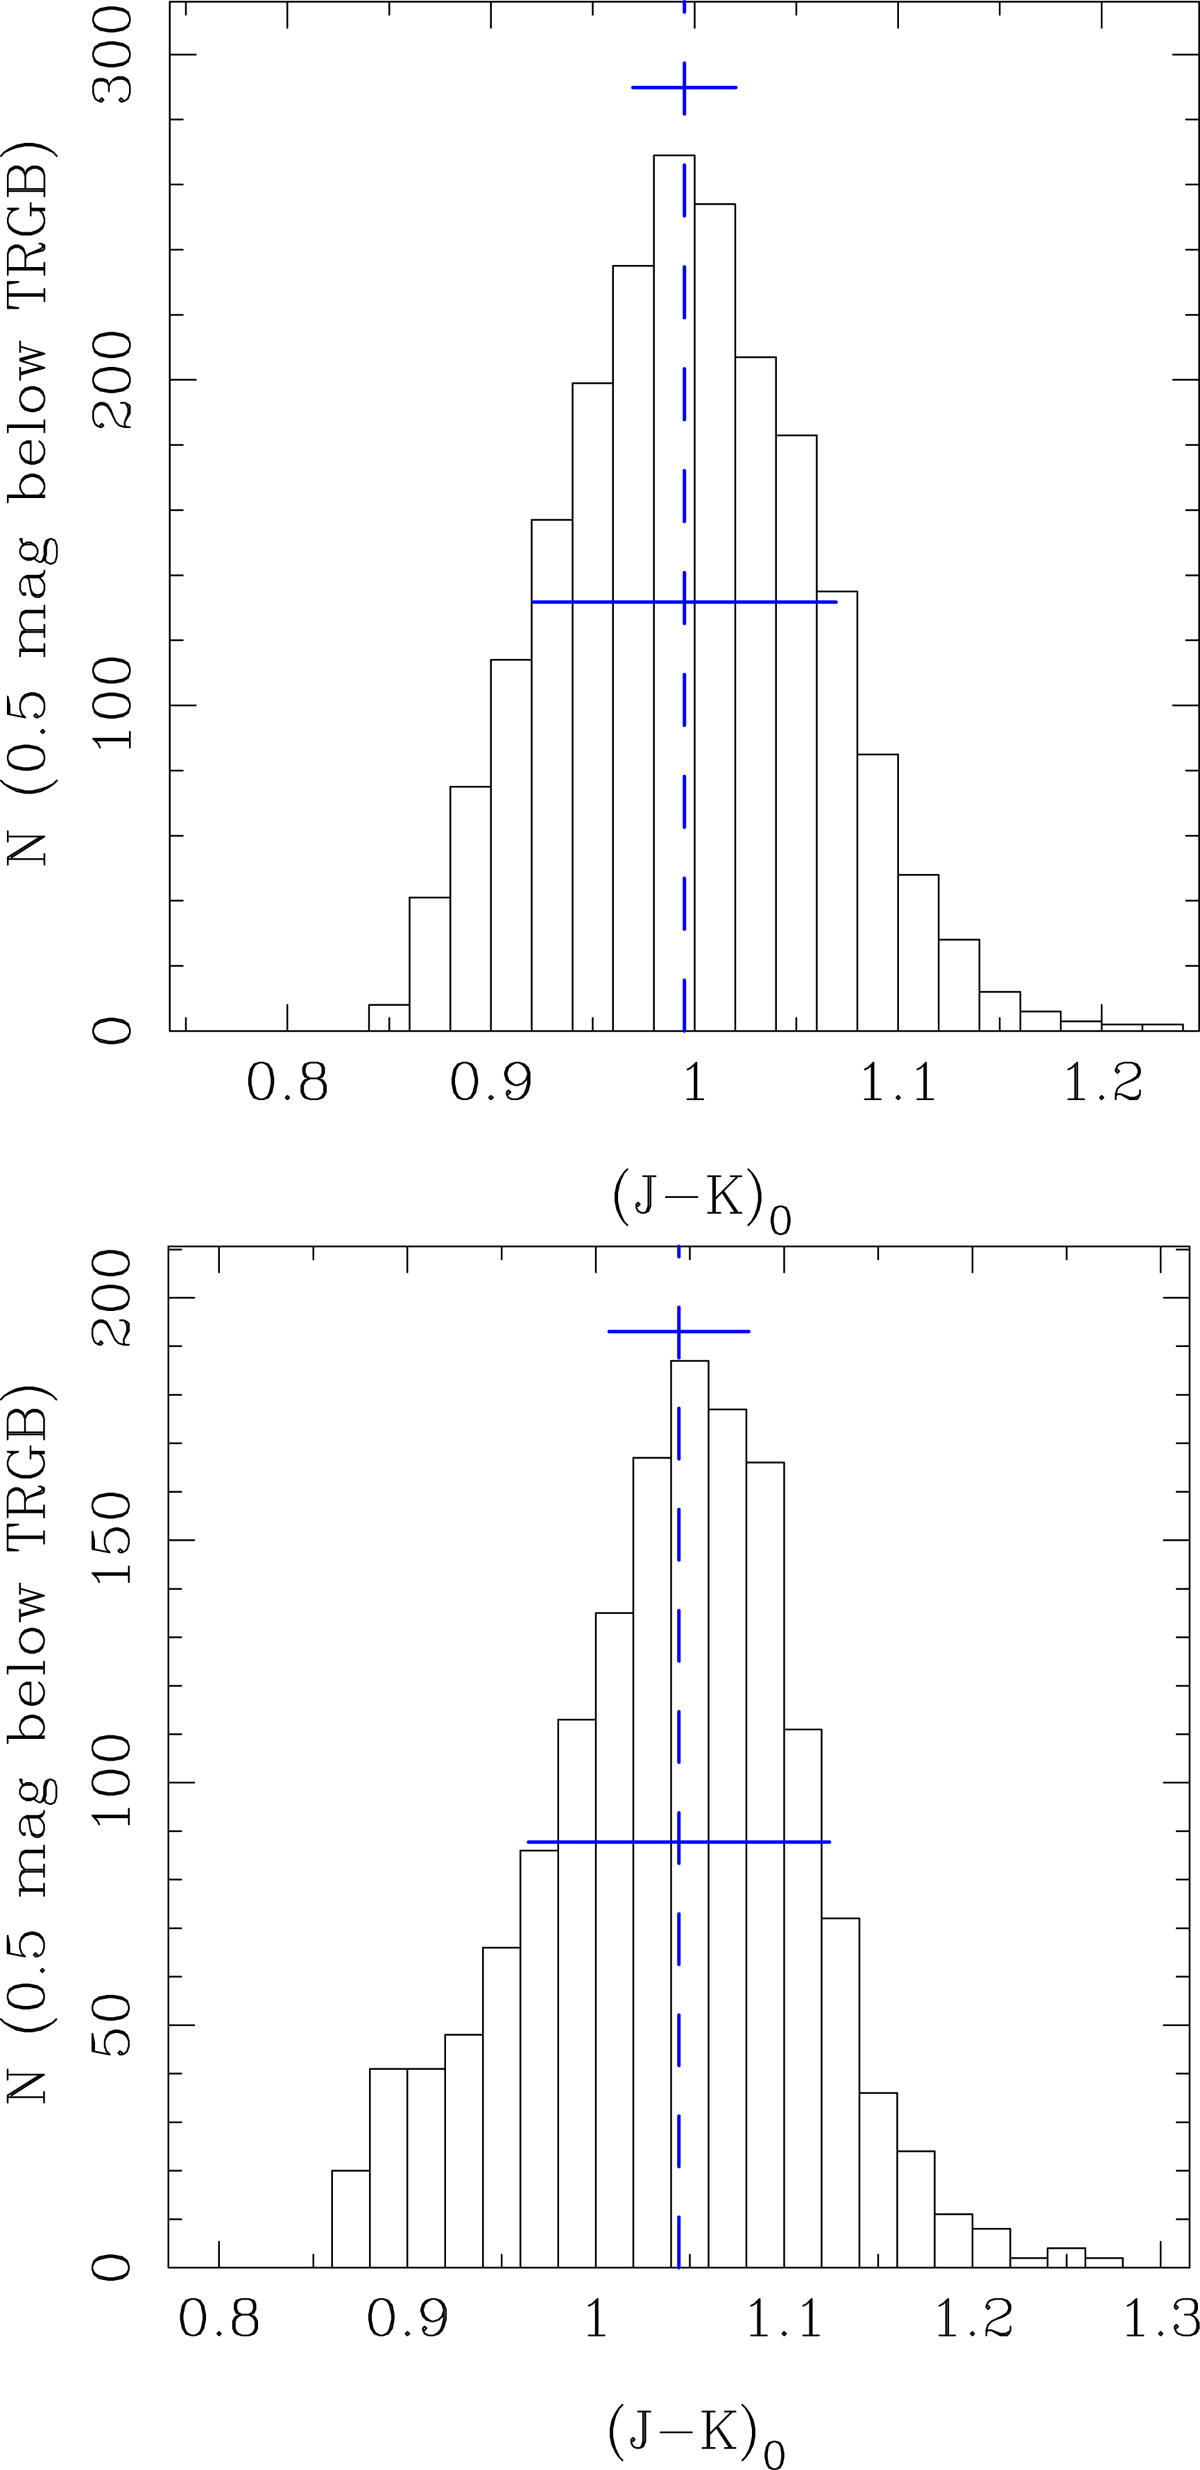
Top panel: results for the simulation. Bottom panel: results for the field around LMC-ECL-09660. The distribution of (J − K) colour at the TRGB, estimated from the general (J − K)−T relation (the blue line in Fig. A.2) using an 0.5 mag interval below the TRGB is shown. The blue dashed and solid lines (roughly at half the maximum) indicate the mean and Gaussian dispersion, respectively. The narrower blue line above the peak indicates the formal error in the (J − K)@TRGB estimate. In the simulation the input was a Gaussian with mean 1.0 mag, and dispersion 0.05 mag. The analysis of the simulated data gives (J − K)@TRGB of 0.996 ± 0.025 mag, and a dispersion in the distribution of 0.063 mag.
Current usage metrics show cumulative count of Article Views (full-text article views including HTML views, PDF and ePub downloads, according to the available data) and Abstracts Views on Vision4Press platform.
Data correspond to usage on the plateform after 2015. The current usage metrics is available 48-96 hours after online publication and is updated daily on week days.
Initial download of the metrics may take a while.