Fig. A.4.
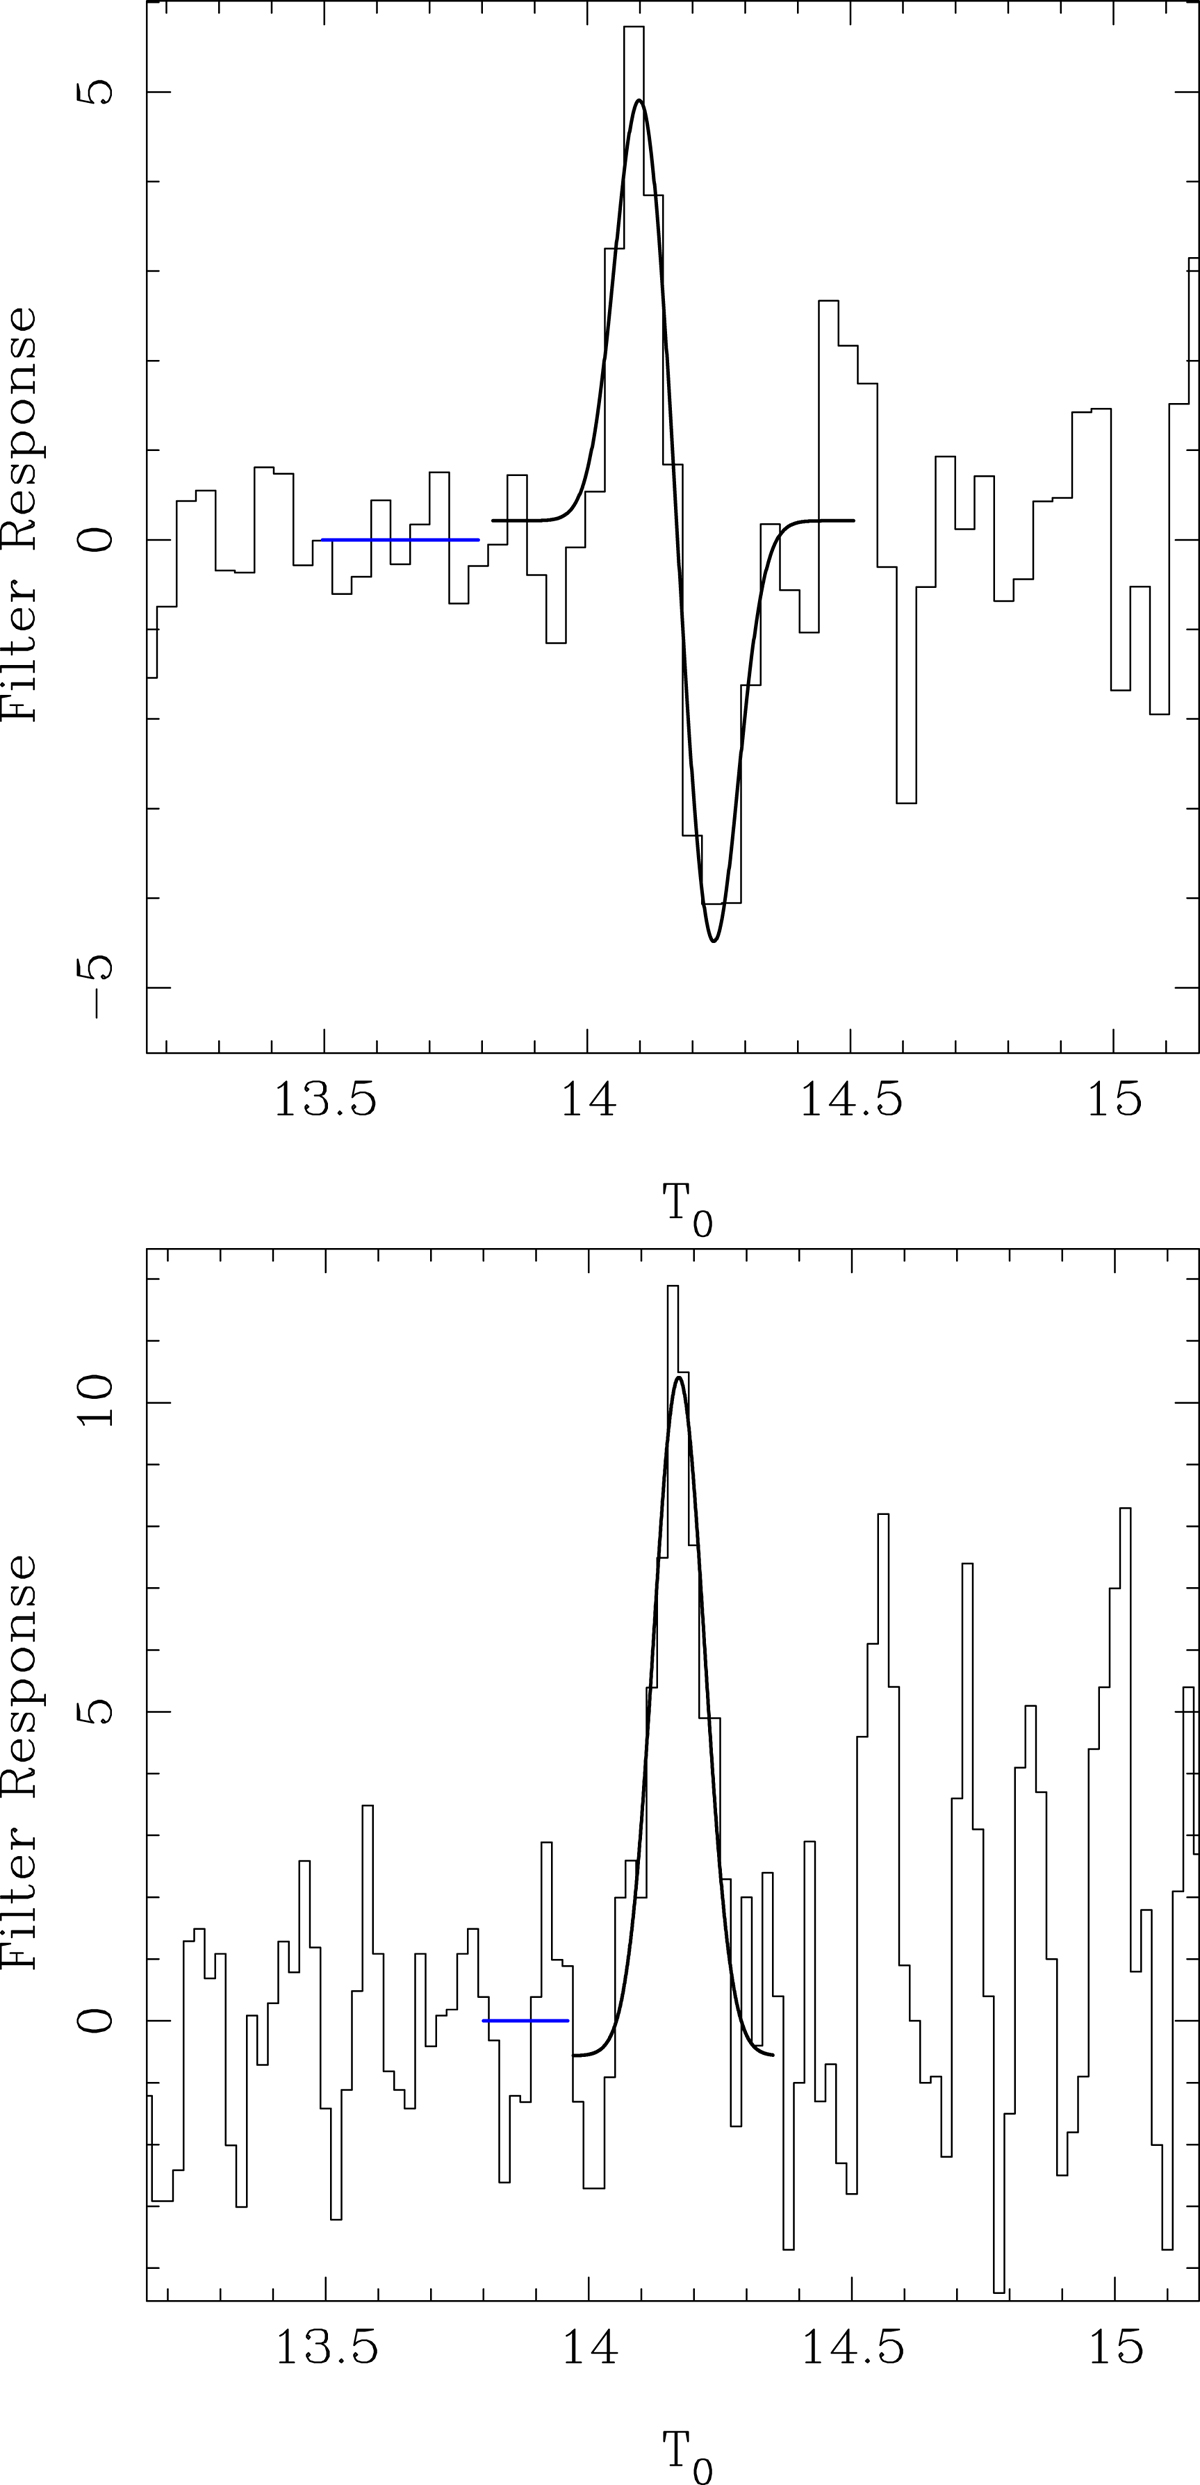
Results of the simulation. Response to the two filters used, one that derives the second-order derivative (and which is fitted with two Gaussians) in the top panel, and in the bottom panel the classic Sobel-like filter that finds the first-order derivative (and which is fitted with a single Gaussian). The blue line indicates the region used to estimate the rms level in the response function. In the top panel the bin width is 0.037 mag, the peak is detected with a S/N of 12, and there are 152 stars per bin between the TRGB and 0.5 mag fainter in the LF. In the bottom panel these numbers are 0.020 mag, 11, and 82 stars/bin. The derived DM are virtually identical: 18.5009 ± 0.0027 (![]() ) and 18.5022 ± 0.0046 mag (
) and 18.5022 ± 0.0046 mag (![]() ), respectively, and very close to the input value of 18.50 mag.
), respectively, and very close to the input value of 18.50 mag.
Current usage metrics show cumulative count of Article Views (full-text article views including HTML views, PDF and ePub downloads, according to the available data) and Abstracts Views on Vision4Press platform.
Data correspond to usage on the plateform after 2015. The current usage metrics is available 48-96 hours after online publication and is updated daily on week days.
Initial download of the metrics may take a while.