Fig. A.2.
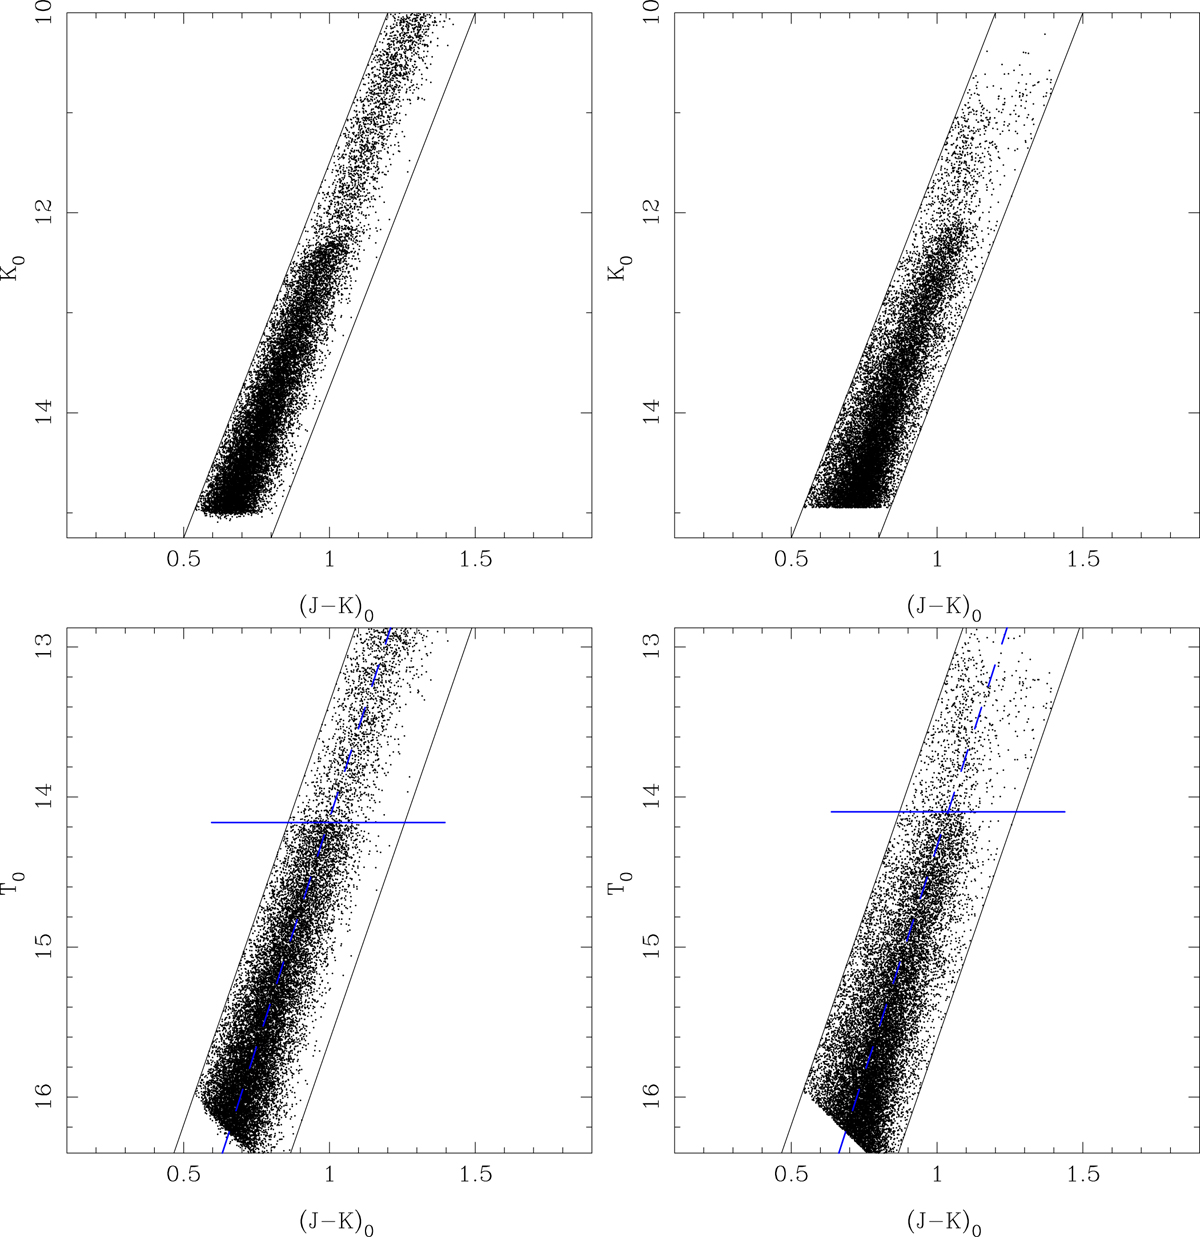
Simulation (two left-hand panels) and real VMC data around LMC-ECL-09660 (two right-hand panels). In the simulation 20 000 stars are generated. The top panels show a classic K, (J − K) CMD. In the left bottom panel the 18 730 stars are plotted that are within the colour selection box, in the T, (J − K) CMD. The blue solid lines indicate the derived location of the TRGB, and the blue dashed line is the mean T, (J − K) relation derived in the interval from the TRGB to one magnitude fainter, but shown for all magnitudes.
Current usage metrics show cumulative count of Article Views (full-text article views including HTML views, PDF and ePub downloads, according to the available data) and Abstracts Views on Vision4Press platform.
Data correspond to usage on the plateform after 2015. The current usage metrics is available 48-96 hours after online publication and is updated daily on week days.
Initial download of the metrics may take a while.