Fig. 5.
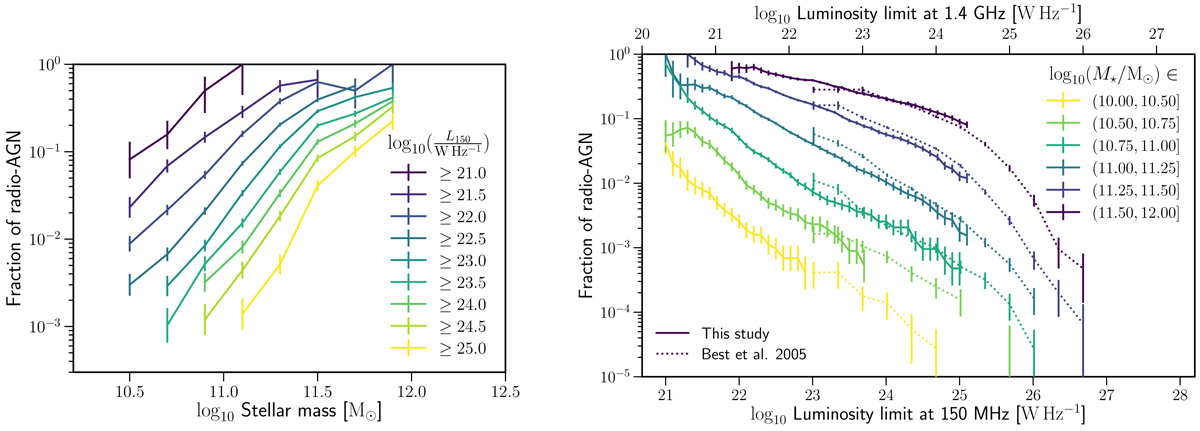
Left panel: fraction of galaxies that host a radio AGN above a given luminosity limit, as a function of stellar mass, for multiple radio luminosity limits (shown in different colours). Right panel: fraction of galaxies hosting radio AGN brighter than a given radio luminosity, separated by their stellar mass. The various stellar mass ranges are shown in different colours. The solid lines represent the results of this (150 MHz) study and dotted lines show the results from Best et al. (2005a) at 1.4 GHz (converted assuming a spectral index of 0.7). The error bars correspond to a confidence interval equivalent to one sigma. The fractions of radio AGN are shown only up to L150 MHz ≈ 1025 W Hz−1 because the number of galaxies above this limit is relatively low and render very large error bars. The highest mass bin would reach a value compatible with 100 per cent within the error at L150 MHz ≤ 1021.7 W Hz−1 but those points are not shown owing to the large error bars.
Current usage metrics show cumulative count of Article Views (full-text article views including HTML views, PDF and ePub downloads, according to the available data) and Abstracts Views on Vision4Press platform.
Data correspond to usage on the plateform after 2015. The current usage metrics is available 48-96 hours after online publication and is updated daily on week days.
Initial download of the metrics may take a while.