Fig. 3.
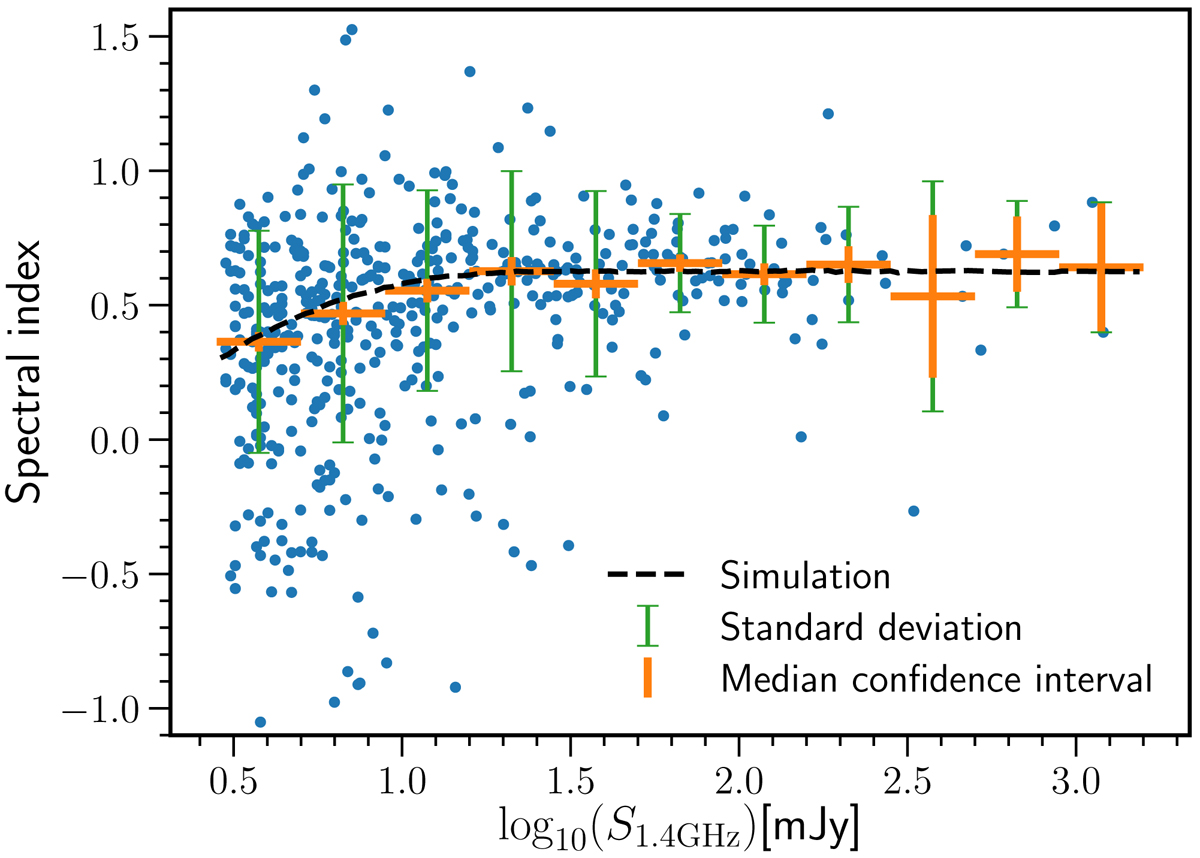
Spectral index distribution of the radio-AGN galaxies with both LoTSS and 1.4 GHz measurements, as a function of 1.4 GHz flux density. Individual sources are shown as blue dots and the medians of different bins in 1.4 GHz flux density are shown as orange crosses. The vertical lines correspond to the standard deviation on each bin. The median spectral index at flux densities S1.4 GHz > 20 mJy is 0.63. The weak decrease in median spectral index at lower flux densities may be driven by selection biases in the 1.4 GHz sample, as indicated by the black dashed line that simulates the effect of this (see text for details).
Current usage metrics show cumulative count of Article Views (full-text article views including HTML views, PDF and ePub downloads, according to the available data) and Abstracts Views on Vision4Press platform.
Data correspond to usage on the plateform after 2015. The current usage metrics is available 48-96 hours after online publication and is updated daily on week days.
Initial download of the metrics may take a while.