Fig. 1.
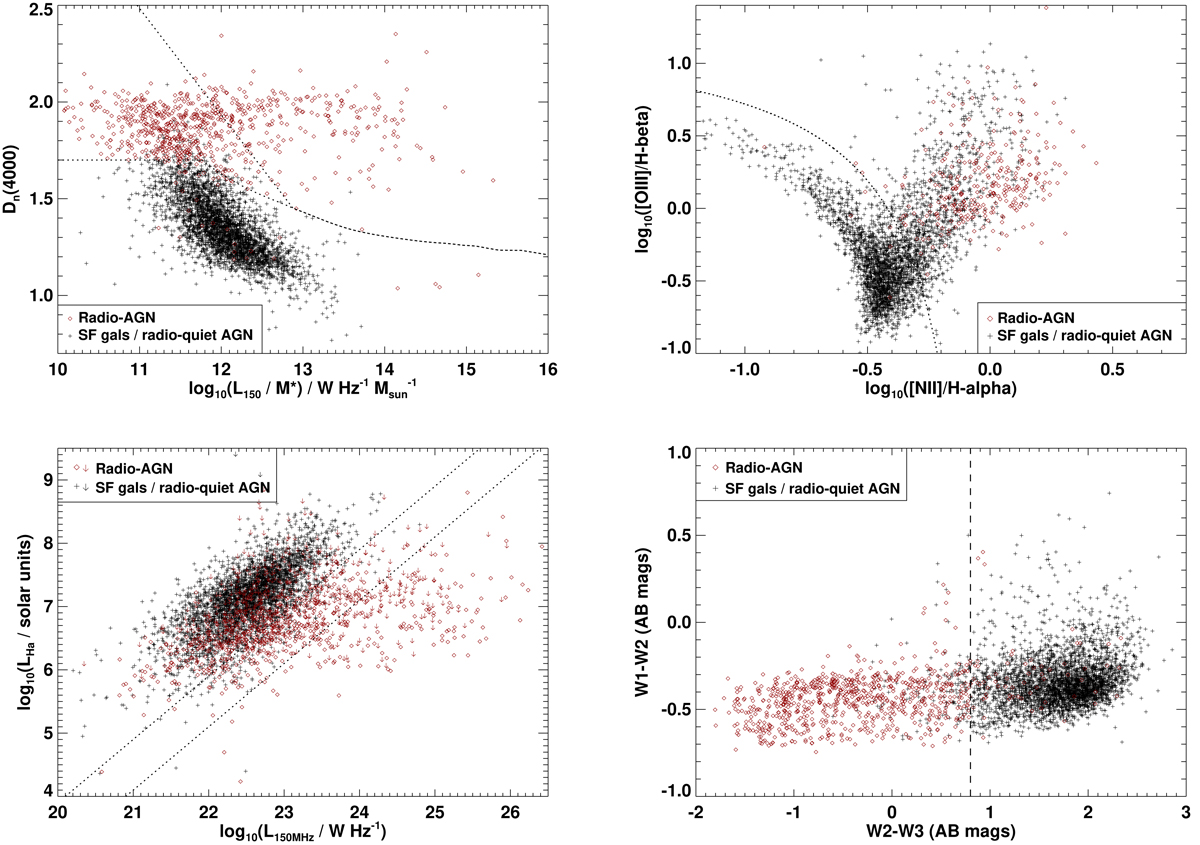
Location of the LoTSS sources on the four diagnostic plots used to separate the radio AGN from those galaxies where the radio emission is powered by SF. Upper left panel: “D4000 vs. L150 MHz/M*” method, developed by Best et al. (2005b). Upper right panel: [OIII]/Hβ vs. [NII]/Hα emission line ratio diagnostic diagram of Baldwin et al. (1981). Lower left panel: LHα vs. L150 MHz relation. Lower right panel: this WISE W1–W2 vs. W2–W3 colour–colour diagnostic. In all plots, the dotted lines indicate the division(s) used for that classification method (see Sect. 3.1 for further details); in the cases of the upper left and lower left plots, there are two division lines; sources between the two lines are deemed to be “intermediate” by that classification method. The different symbols reflect the final combined classification of each source: radio AGN are plotted as red diamonds and SFGs as black crosses. In the lower left plot, arrows indicate upper limits to the Hα luminosity.
Current usage metrics show cumulative count of Article Views (full-text article views including HTML views, PDF and ePub downloads, according to the available data) and Abstracts Views on Vision4Press platform.
Data correspond to usage on the plateform after 2015. The current usage metrics is available 48-96 hours after online publication and is updated daily on week days.
Initial download of the metrics may take a while.