Table 3.
List of GL candidates.
| Num. | Candidate identifier | Nimg | Right ascension | Declination | Size | Field density | ΔG | Δ(GBP − GRP) | ERT prob. |
|---|---|---|---|---|---|---|---|---|---|
| (°) | (°) | (mas) | (obj. deg−2) | (mag) | (mag) | ||||
| [4] | 214110146+314107480 | 4 | 325.292262 | 31.685426 | 3602 | 27 502 | 0.67 | 1.00 | |
| [8] | 053036992–373011003 | 3 | 82.654147 | −37.503067 | 1036 | 27 502 | 2.99 | 0.98 | |
| [11] | 153725327–301017053 | 3 | 234.355552 | −30.171385 | 3286 | 45 837 | 0.22 | 0.63(2) | 0.97 |
| [12] | 113100013–441959935 | 4 | 172.750041 | −44.333297 | 1631 | 36 669 | 0.99 | 0.02(2) | 0.96 |
| [15] | 081602164–530722970 | 4 | 124.009037 | −53.123042 | 4823 | 27 502 | 0.87 | 0.34(3) | 0.95 |
| [16] | 175443398+214054818 | 3 | 268.680823 | 21.681869 | 1755 | 18 335 | 0.45 | 0.95 | |
| [17] | 065904044+162908685 | 3 | 104.766823 | 16.485772 | 5249 | 36 669 | 1.47 | 0.14(2) | 0.94 |
| [18] | 182244519–541451730 | 4 | 275.685519 | −54.247701 | 5256 | 27 502 | 1.22 | 0.11(4) | 0.94 |
| [19] | 054934271+051814610 | 3 | 87.392794 | 5.304042 | 2298 | 45 837 | 0.43 | 0.93 | |
| [20] | 075933618–173212537 | 3 | 119.890101 | −17.536806 | 1860 | 55 004 | 1.23 | 0.93 | |
| [23] | 181730853+272940139 | 3 | 274.378545 | 27.494468 | 1796 | 36 669 | 1.79 | 0.91 | |
| [25] | 024848742+191330571 | 3 | 42.203097 | 19.225140 | 1677 | 13 751 | 0.30 | 0.06(2) | 0.88 |
| [26] | 201454150–302452196 | 3 | 303.725615 | −30.414491 | 2465 | 13 751 | 0.48 | 0.32(2) | 0.88 |
| [28] | 201749047+620443509 | 3 | 304.454360 | 62.078774 | 916 | 36 669 | 0.99 | 0.74 | |
| [30] | 011559515+562506671 | 3 | 18.997963 | 56.418524 | 2756 | 45 837 | 0.70 | 0.60 |
Notes. The finding charts depicting all of these candidates are given in Fig. 4. The numbers in parentheses in Col. Δ(GBP − GRP) correspond to the number of images that were used in the computation of the maximum absolute difference in colour.
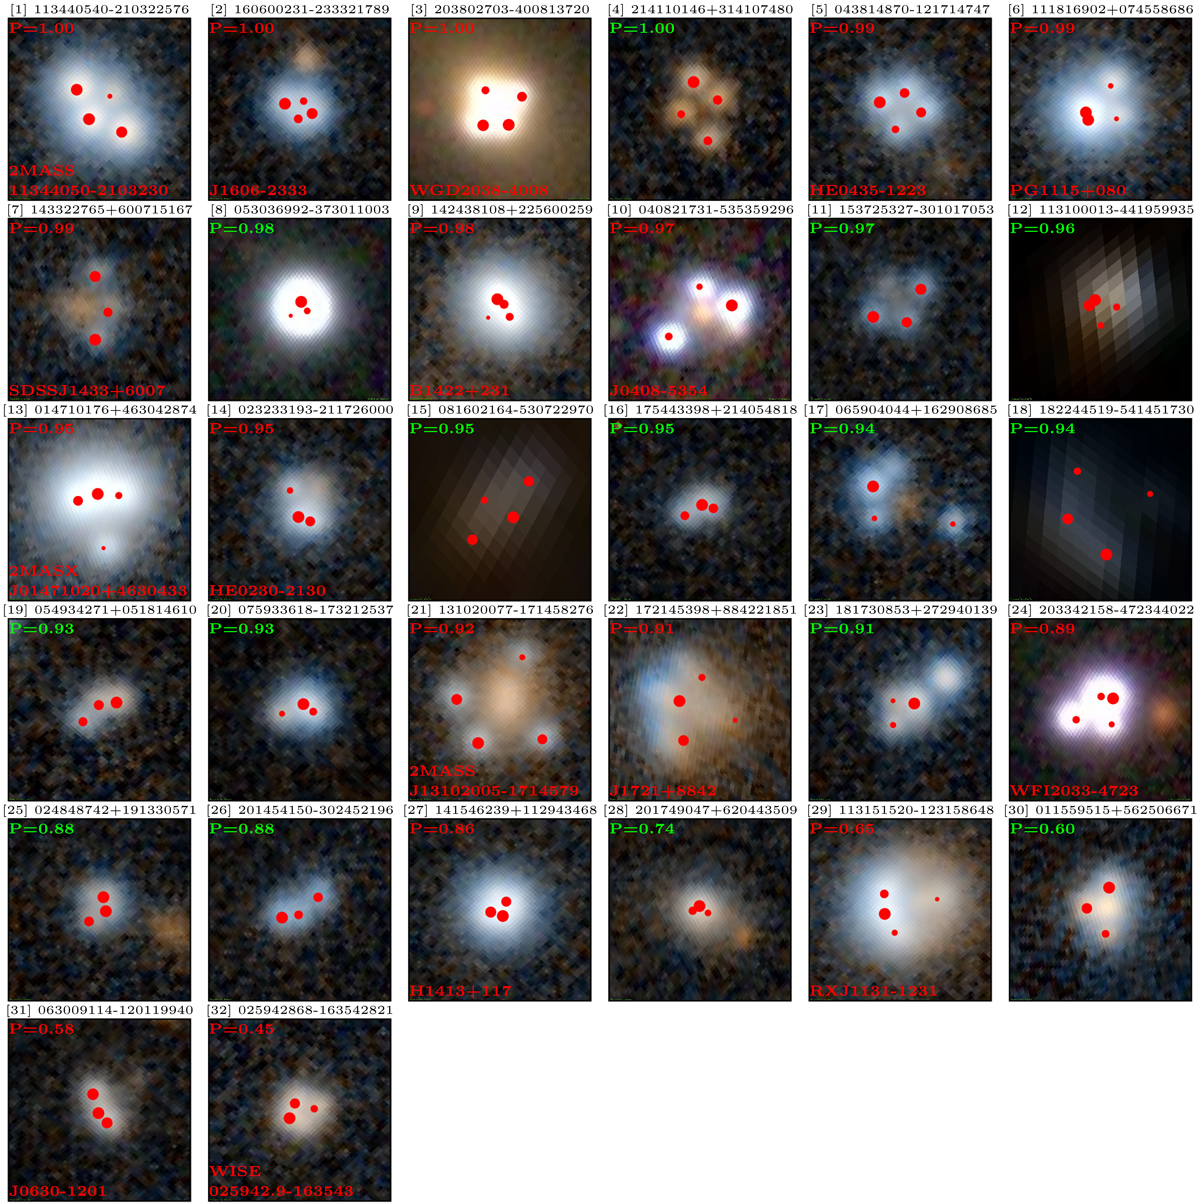
Fig. 4.
Finding charts of the 17 known GLs and 15 GL candidates contained in our catalogue of clusters (Appendix B). They are ordered according to their ERT probabilities (upper left corner of each subplot). The common name of the known lenses is labelled in red in the lower left corner of each subplot, while the candidates we propose have their probabilities written in green fonts. Images [1], [2], [4–7], [9], [11], [13], [14], [16], [17], [19–23], [25–32] come from the Pan-STARRS survey (Chambers et al. 2016); images [12], [15], [18] come from the Digitized Sky Survey II (Lasker et al. 1996); and images [3], [8], [10], [24] come from the DES (Dark Energy Survey Collaboration et al. 2016). All images were collected from the ALADIN sky atlas (Bonnarel et al. 2000) in a field of view of 10.8″ × 10.8″ centred around the mean coordinates of the GL where east is to the left and north is up. Points are scaled according to the relative flux of the components with respect to the brightest image of each configuration.
Current usage metrics show cumulative count of Article Views (full-text article views including HTML views, PDF and ePub downloads, according to the available data) and Abstracts Views on Vision4Press platform.
Data correspond to usage on the plateform after 2015. The current usage metrics is available 48-96 hours after online publication and is updated daily on week days.
Initial download of the metrics may take a while.