Fig. 3.
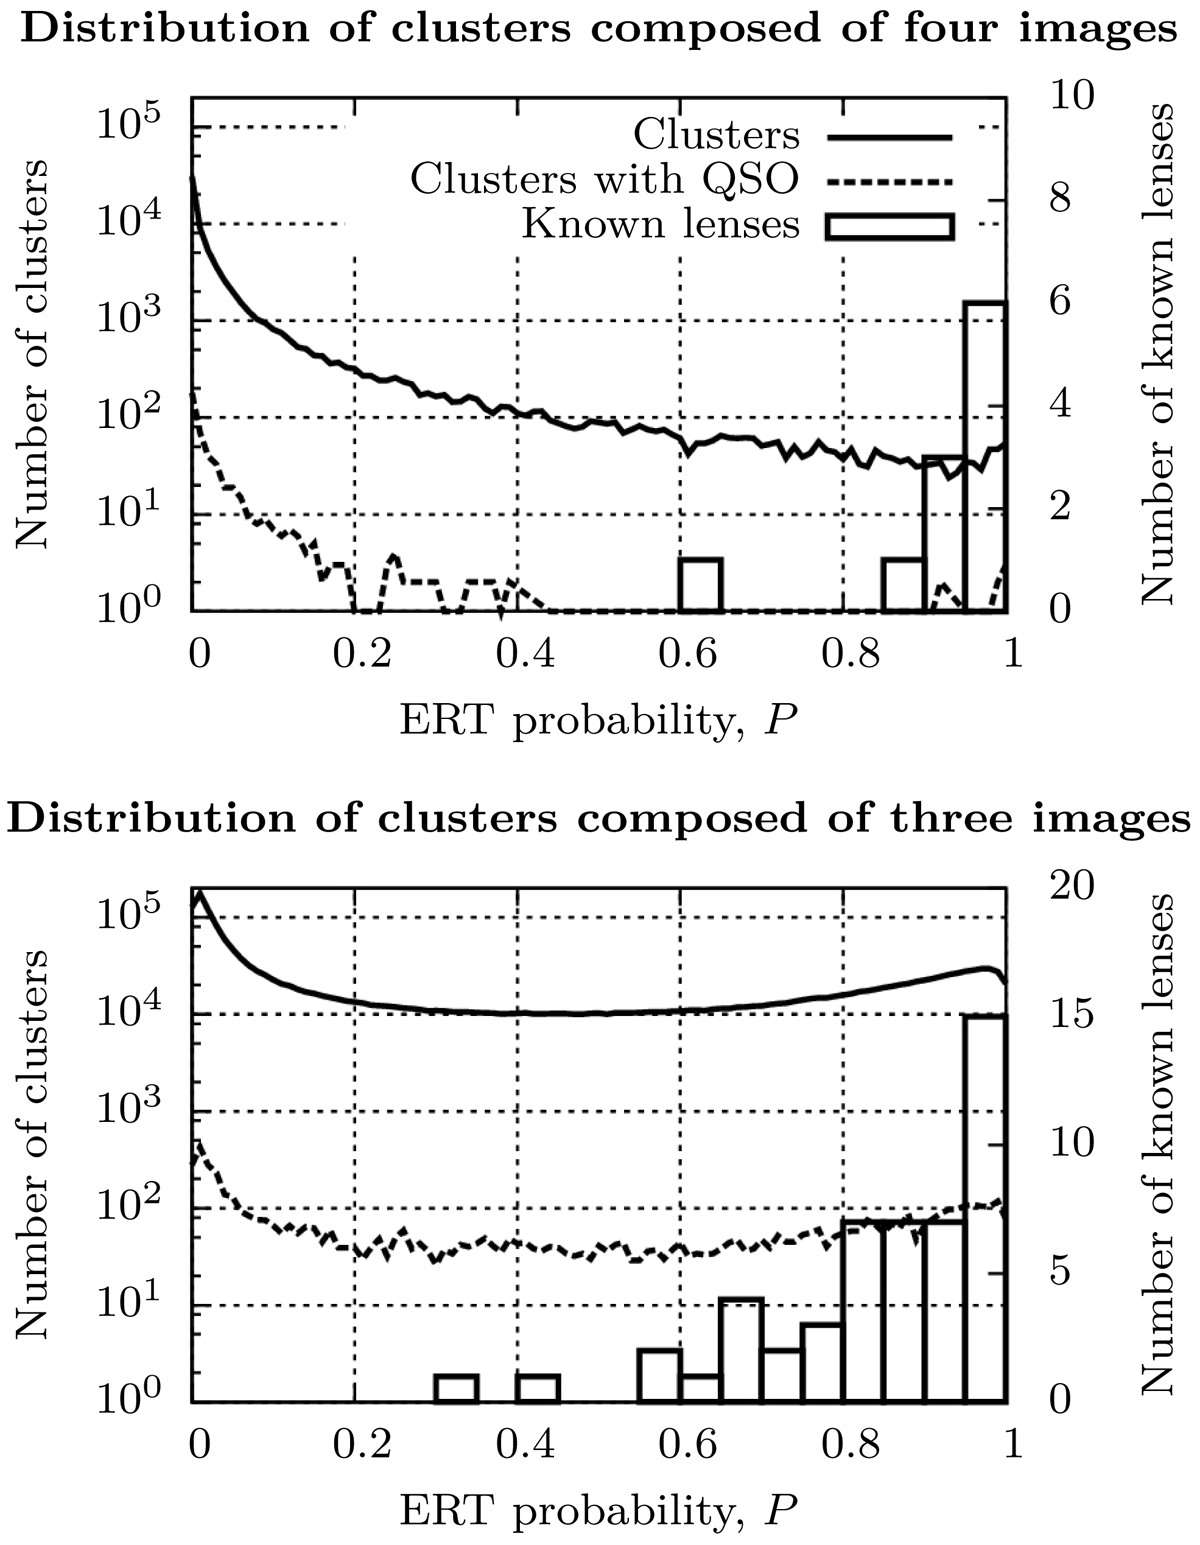
Distribution of the 70 697 clusters composed of four images and 2 058 962 clusters composed of three images extracted from the Gaia DR2 (see Sect. 2) with respect to their ERT probabilities (solid line). The distribution of the known lenses are represented as boxes, whereas the distribution of the 6,944 clusters resulting from the cross-match we performed between our entire list of clusters and our compiled list of quasars is depicted as a dotted line in each graph (see Sect. 3.4.2). In cases where clusters are composed of three images, the ERT probability corresponds to the maximum of the ERT probabilities returned by the ABC, ABD, ACD, and BCD models.
Current usage metrics show cumulative count of Article Views (full-text article views including HTML views, PDF and ePub downloads, according to the available data) and Abstracts Views on Vision4Press platform.
Data correspond to usage on the plateform after 2015. The current usage metrics is available 48-96 hours after online publication and is updated daily on week days.
Initial download of the metrics may take a while.