Fig. 2.
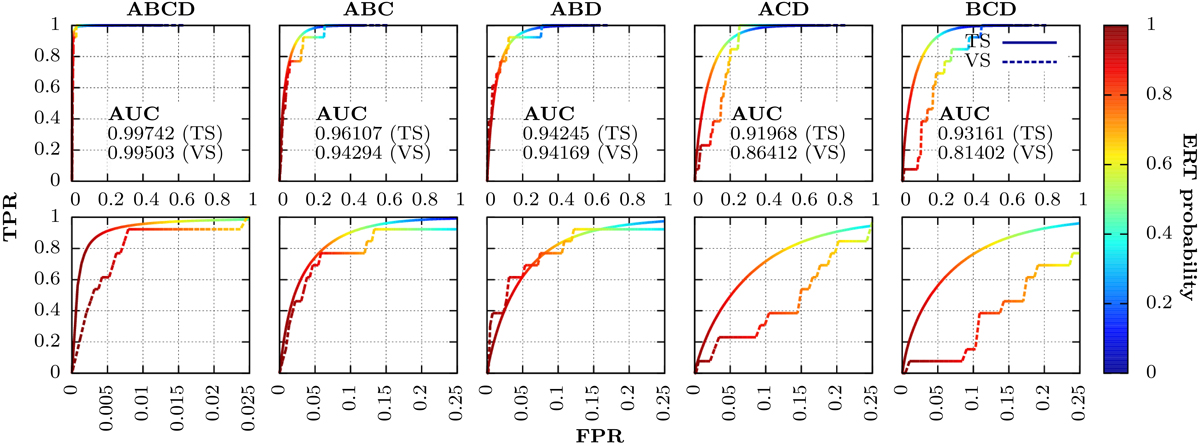
Receiver operating characteristics (ROC) curve of the ABCD, ABC, ABD, ACD, and BCD models based on the test set (TS) and validation set (VS) of observations. The upper panels show the entire ROC curves, whereas the lower panels concentrate on the low FPR regions of each curve. The classification performances of each model is evaluated through the computation of the area under each of the TS–ROC and VS–ROC curves (AUC).
Current usage metrics show cumulative count of Article Views (full-text article views including HTML views, PDF and ePub downloads, according to the available data) and Abstracts Views on Vision4Press platform.
Data correspond to usage on the plateform after 2015. The current usage metrics is available 48-96 hours after online publication and is updated daily on week days.
Initial download of the metrics may take a while.