Fig. 1.
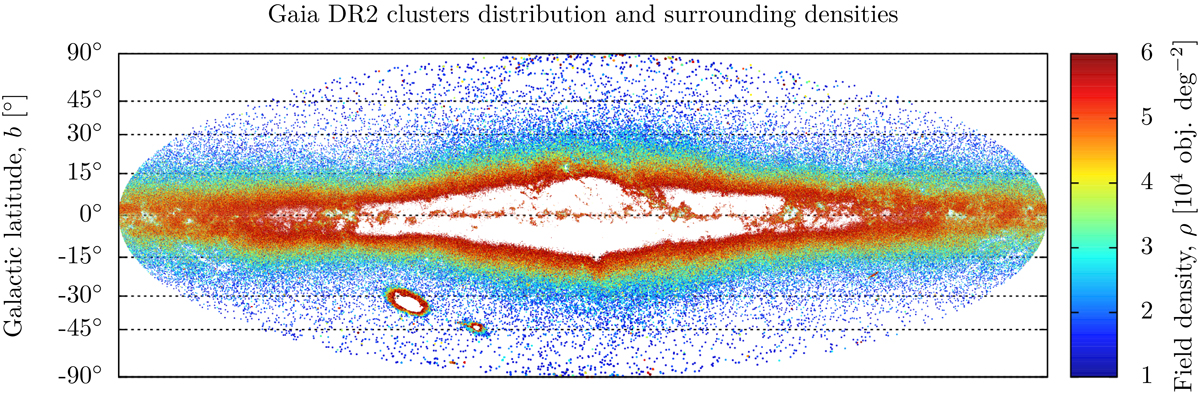
Distribution of the 2 129 659 clusters of objects extracted from the Gaia DR2 catalogue. They are composed of three and four images that pass the soft astrometric test (see Sect. 2) that have a maximum angular separation between components that is smaller than 6″, that have absolute differences in G magnitudes of < 4 mag, and that are found in regions of the celestial sphere where the mean field density is lower than 6 × 10⁴ objects deg−2. Lower density regions near the galactic centre can be explained by the filtering occurring in the on-board processing in order to prevent memory from saturating in such very dense regions of the sky (Gaia Collaboration 2016).
Current usage metrics show cumulative count of Article Views (full-text article views including HTML views, PDF and ePub downloads, according to the available data) and Abstracts Views on Vision4Press platform.
Data correspond to usage on the plateform after 2015. The current usage metrics is available 48-96 hours after online publication and is updated daily on week days.
Initial download of the metrics may take a while.