Fig. 3.
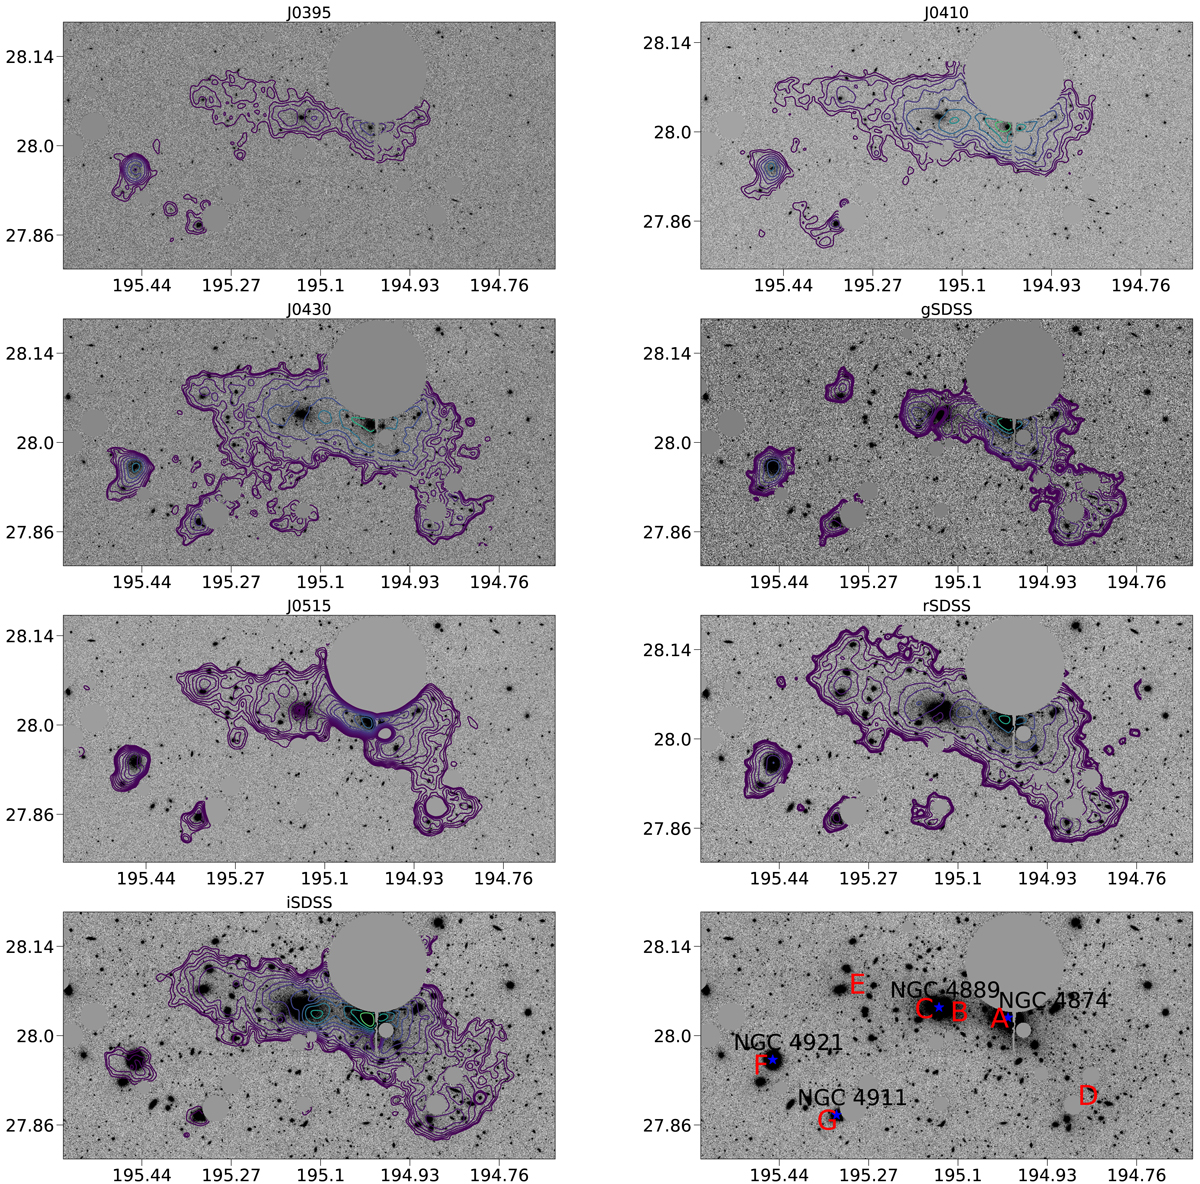
Contour maps of the ICL in the central region of the Coma clusters superimposed on the original data, and guiding image to identify the ICL substructure (bottom right panel). Original images have the stars and spikes masked out. We have smoothed the surface distribution of the ICL with a Gaussian of 17.6 arcsec typical deviation to draw the contours. Masked-out pixels were not considered to estimate the ICL fraction or calculate the contours. The guiding image at the bottom right shows the original image in the i band with the main galaxies (blue stars) and ICL clumps (red letters) labeled. North is up and east is to the left.
Current usage metrics show cumulative count of Article Views (full-text article views including HTML views, PDF and ePub downloads, according to the available data) and Abstracts Views on Vision4Press platform.
Data correspond to usage on the plateform after 2015. The current usage metrics is available 48-96 hours after online publication and is updated daily on week days.
Initial download of the metrics may take a while.