Free Access
Fig. 2.
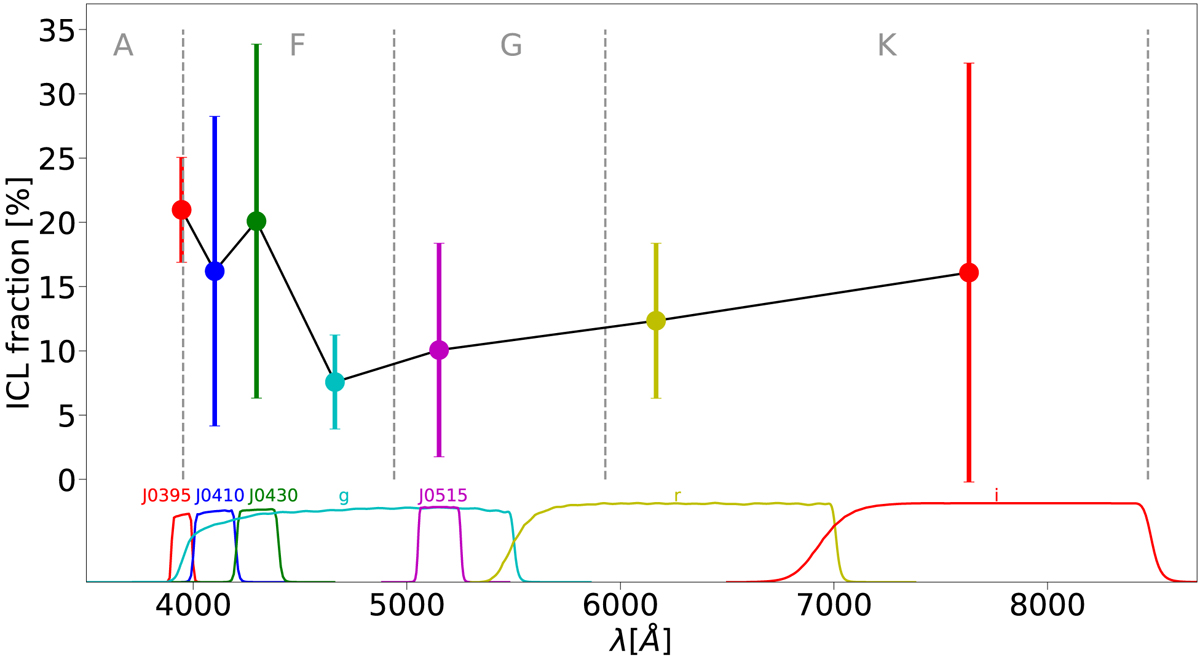
ICL fractions for Coma as a function of the wavelength. Transmission curves of the seven J-PLUS filters we analyzed are shown, with the same color code as the ICL fractions. Vertical gray lines delimit the intervals were the emission peaks of each stellar spectral type are contained, as indicated at the top of each region.
Current usage metrics show cumulative count of Article Views (full-text article views including HTML views, PDF and ePub downloads, according to the available data) and Abstracts Views on Vision4Press platform.
Data correspond to usage on the plateform after 2015. The current usage metrics is available 48-96 hours after online publication and is updated daily on week days.
Initial download of the metrics may take a while.