Fig. 1.
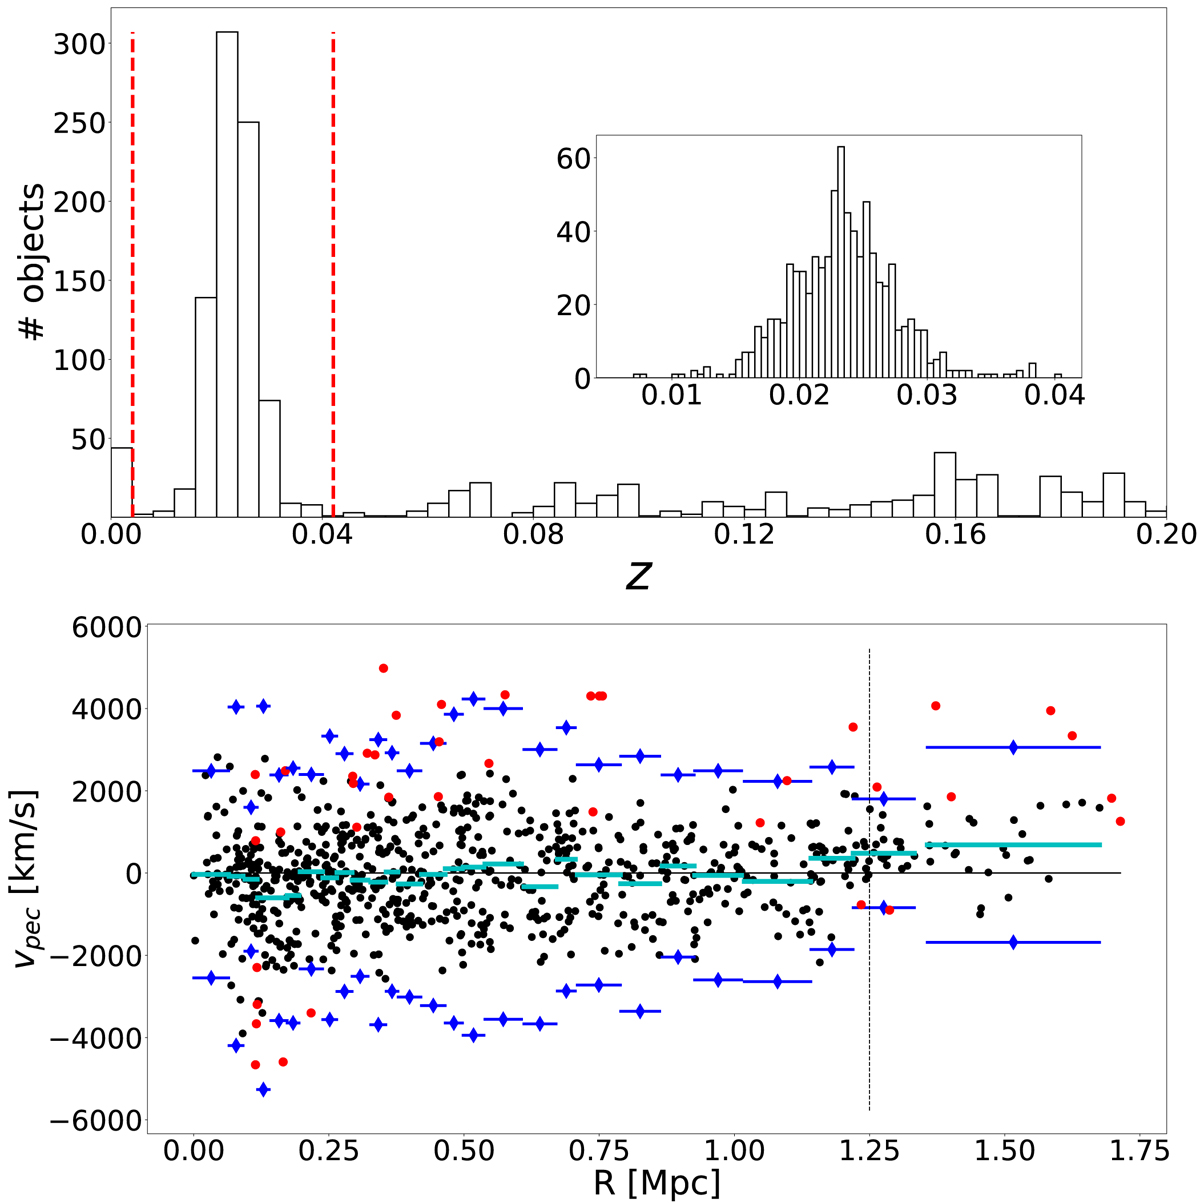
Cluster membership for the Coma cluster with the PEAK+GAP algorithm. Top panel: redshift distribution of the objects in our spectroscopic catalog. Vertical red lines identify the redshift window with the possible member candidates, as obtained from the PEAK method. The inset displays a zoom-in of this window, with a smaller bin size for illustration purposes. Bottom panel: peculiar velocity-clustercentric distance plane from the GAP algorithm. Bona fide members are plotted with black points, while rejected candidates are shown in red. Cyan horizontal lines with squares indicate the mean peculiar velocity on each bin, while blue lines with diamonds correspond to the 3σ limit. The vertical black dotted line marks the radius up to which the gap algorithm is reliable, since the standard deviations systematically increase from this point. All the candidates outside this radius are discarded.
Current usage metrics show cumulative count of Article Views (full-text article views including HTML views, PDF and ePub downloads, according to the available data) and Abstracts Views on Vision4Press platform.
Data correspond to usage on the plateform after 2015. The current usage metrics is available 48-96 hours after online publication and is updated daily on week days.
Initial download of the metrics may take a while.