Fig. 4.
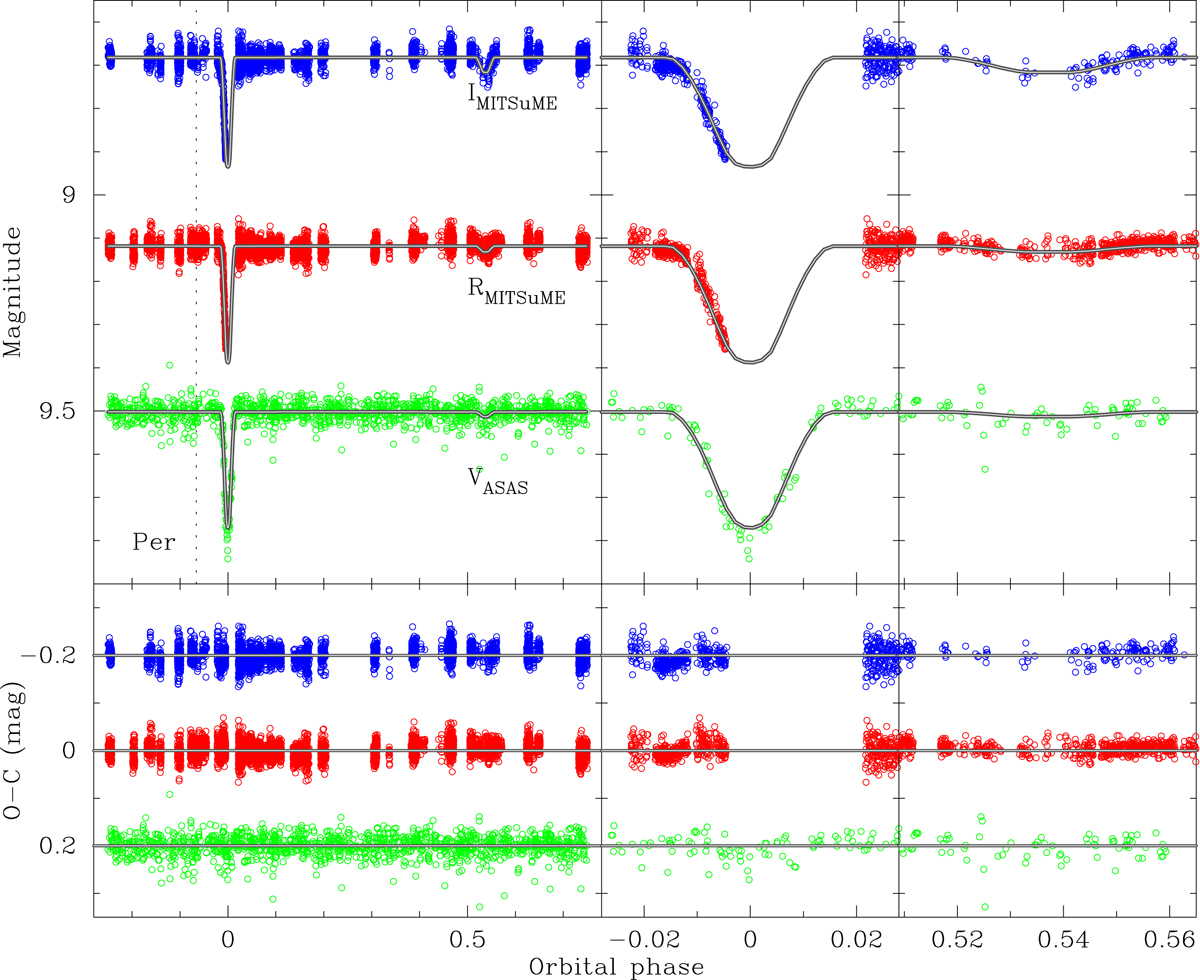
Model light curves (white lines) and measurements (coloured points) of ASAS-052. The Y axis shows the observed magnitude, with no vertical shifts. Bands and instruments are labelled. Residuals (O − C) are shown below. For consistency, phase zero is set to the primary eclipse mid-time T0. The phase of pericentre passage is marked with a vertical dotted line and labelled “Per”. Note how the depth of the secondary eclipse changes with wavelength.
Current usage metrics show cumulative count of Article Views (full-text article views including HTML views, PDF and ePub downloads, according to the available data) and Abstracts Views on Vision4Press platform.
Data correspond to usage on the plateform after 2015. The current usage metrics is available 48-96 hours after online publication and is updated daily on week days.
Initial download of the metrics may take a while.