Fig. 1.
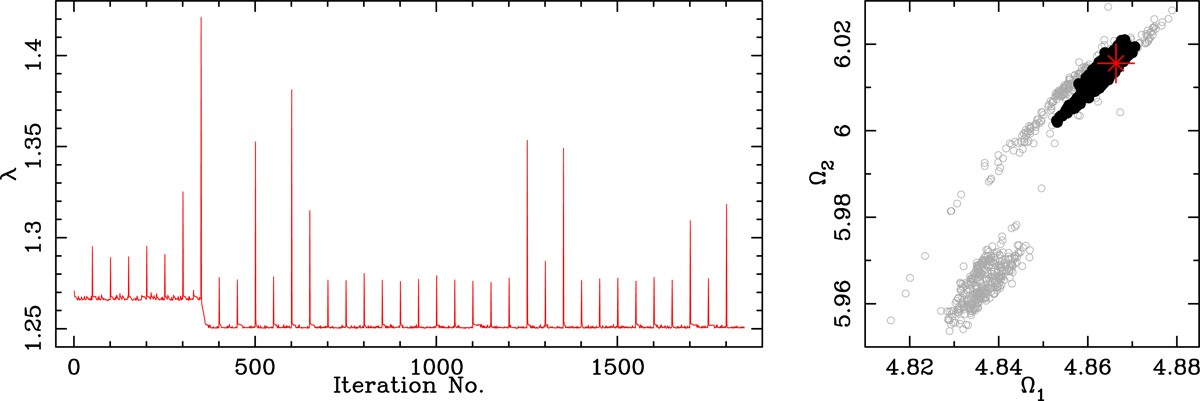
Example of the parameter error evaluation with PHOEBE, in the case of ASAS-073. Left panel: evolution of the cost function λ. Peaks represent iterations immediately after the kicks. A more significant (deeper, λ ≃ 1.25) minimum in the parameter hyperspace was found after iteration no. 350. Right panel: mapping the degeneration between Kopal’s modified potentials Ω. The solutions included in the final error calculation are plotted with black dots, and those that were rejected (shallower minimum or still before convergence) are plotted with grey circles. The red × symbol with error bars represents the best fit (lowest λ) and the final 1σ uncertainties.
Current usage metrics show cumulative count of Article Views (full-text article views including HTML views, PDF and ePub downloads, according to the available data) and Abstracts Views on Vision4Press platform.
Data correspond to usage on the plateform after 2015. The current usage metrics is available 48-96 hours after online publication and is updated daily on week days.
Initial download of the metrics may take a while.