Fig. E.3.
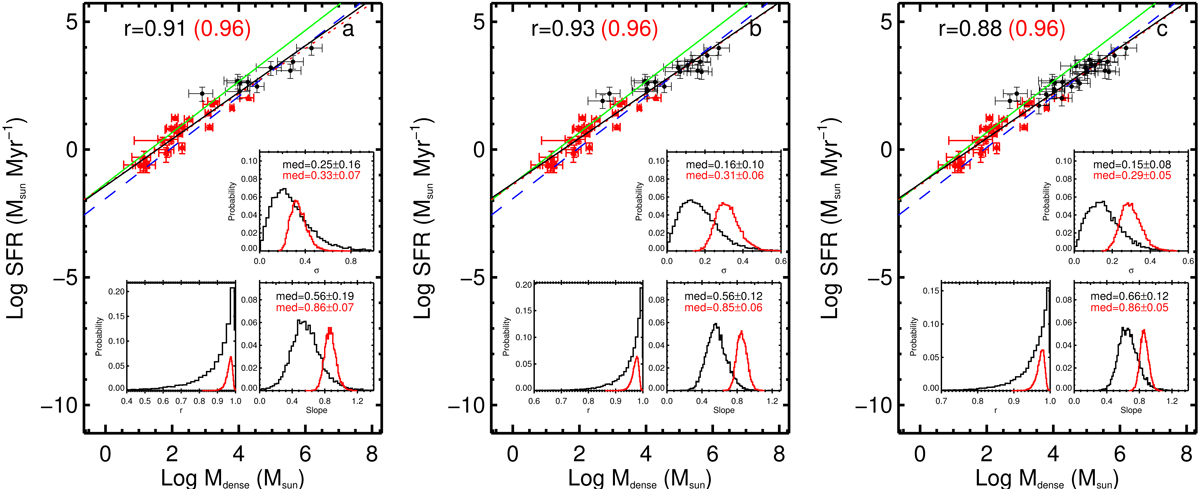
SFR as a function of Mdense for GMFs that are located within 3.5 kpc plus nearby clouds (panel a); GMFs that are located within 4 kpc plus nearby clouds (panel b); GMFs that are located within 5 kpc plus nearby clouds (panel c). The GMFs are marked with black filled circles while the nearby clouds are labeled with red triangles. The straight lines represent Lada’s equation (green solid line, Lada et al. 2010), the relation from Wu et al. (2005; blue dashed line), fitting result from Evans et al. (2014; red dotted line), and our linear fitting results without considering uncertainties (black solid line). The correlation coefficients between SFR and Mdense obtained without considering uncertainties are shown at the top of each panel and the black fonts are for GMFs while the red fonts are for GMFs + nearby clouds. The inset plots in each panel show the probability distributions of correlation coefficients (r), fitting slopes, and intrinsic scatters (σ) obtained with Bayesian linear regression method by Kelly (2007) for GMFs (black line) and GMFs + nearby clouds (red line).
Current usage metrics show cumulative count of Article Views (full-text article views including HTML views, PDF and ePub downloads, according to the available data) and Abstracts Views on Vision4Press platform.
Data correspond to usage on the plateform after 2015. The current usage metrics is available 48-96 hours after online publication and is updated daily on week days.
Initial download of the metrics may take a while.