Fig. E.1.
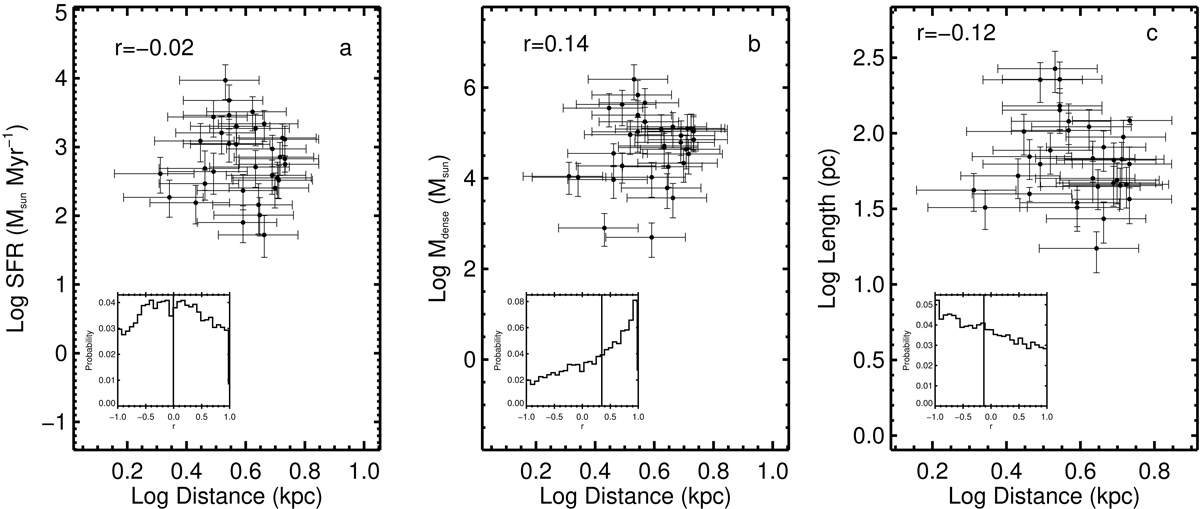
SFRs (panel a), Mdense (panel b), and length (panel c) versus distance of GMFs that are located within 5.5 kpc in the log-log plane. The correlation coefficients between different parameter sets obtained without considering uncertainties are shown at the top of each panel. The inset plots in each panel show the probability distributions of correlation coefficients (r) obtained with Bayesian linear regression method by Kelly (2007) and the vertical lines in the inset plots indicate the median values.
Current usage metrics show cumulative count of Article Views (full-text article views including HTML views, PDF and ePub downloads, according to the available data) and Abstracts Views on Vision4Press platform.
Data correspond to usage on the plateform after 2015. The current usage metrics is available 48-96 hours after online publication and is updated daily on week days.
Initial download of the metrics may take a while.