Free Access
Fig. D.4.
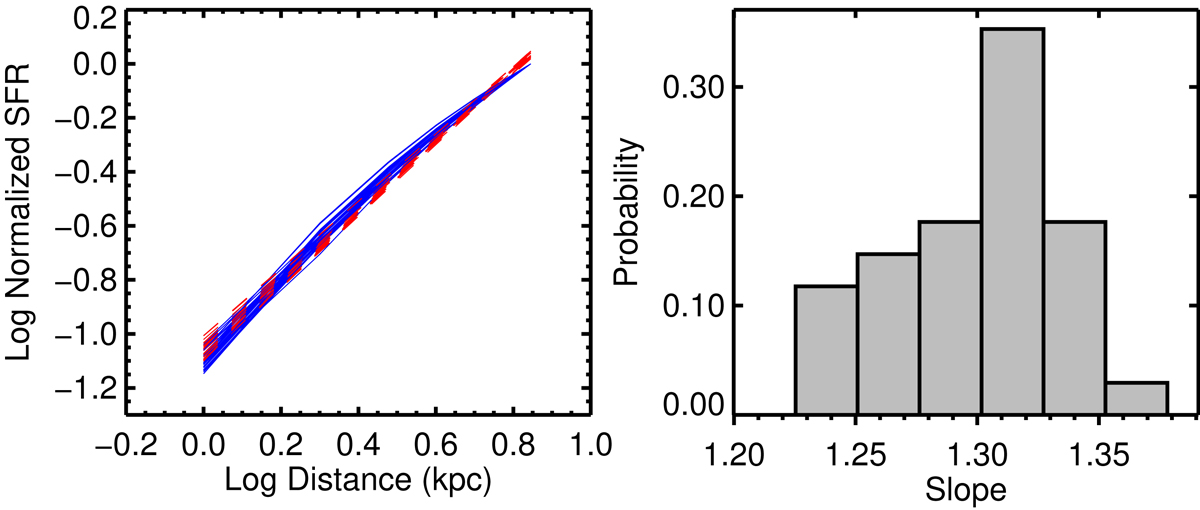
Left panel: relations between SFR and distance for 34 GMFs. Each blue curve represents one GMF. The red dashed lines show the linear fits to the blue curves; right panel: distribution of fitting slopes.
Current usage metrics show cumulative count of Article Views (full-text article views including HTML views, PDF and ePub downloads, according to the available data) and Abstracts Views on Vision4Press platform.
Data correspond to usage on the plateform after 2015. The current usage metrics is available 48-96 hours after online publication and is updated daily on week days.
Initial download of the metrics may take a while.