Fig. 3.
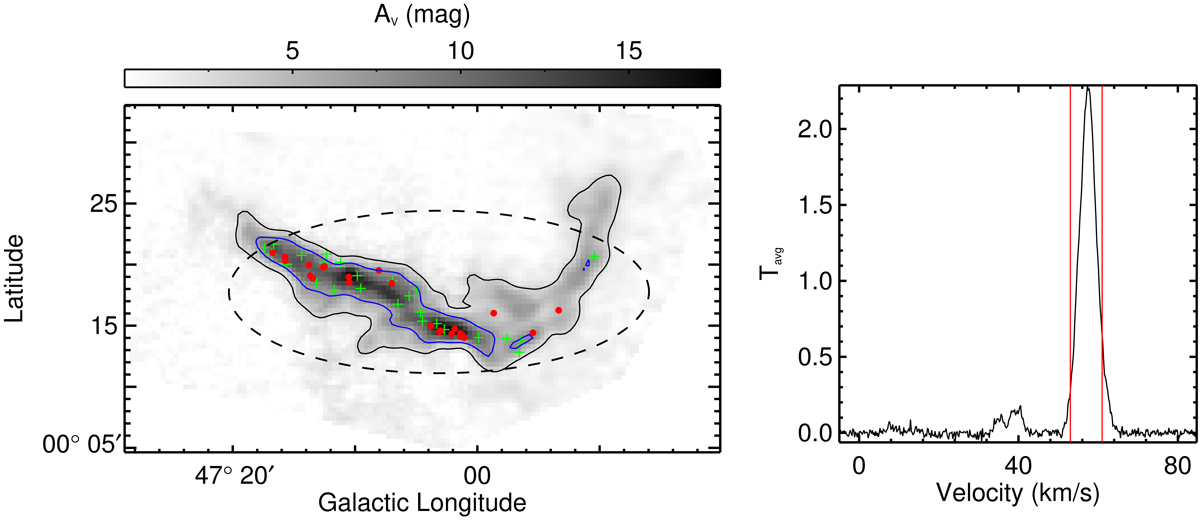
Overview of GMF 39 (CFG047.06+0.26). Left panel: background is CO-based extinction map. The black and blue contours represent the visual extinction of AV = 3 and 7 mag, individually. The dashed ellipses are obtained through fitting the pixels inside the regions with AV > 3 mag. The identified YSOs are labeled with red filled circles (Class I) and green pluses (Class II). Right panel: 13CO average spectrum for the region with AV > 3 mag. The red vertical lines mark the GMF velocity range.
Current usage metrics show cumulative count of Article Views (full-text article views including HTML views, PDF and ePub downloads, according to the available data) and Abstracts Views on Vision4Press platform.
Data correspond to usage on the plateform after 2015. The current usage metrics is available 48-96 hours after online publication and is updated daily on week days.
Initial download of the metrics may take a while.