Fig. C.2.
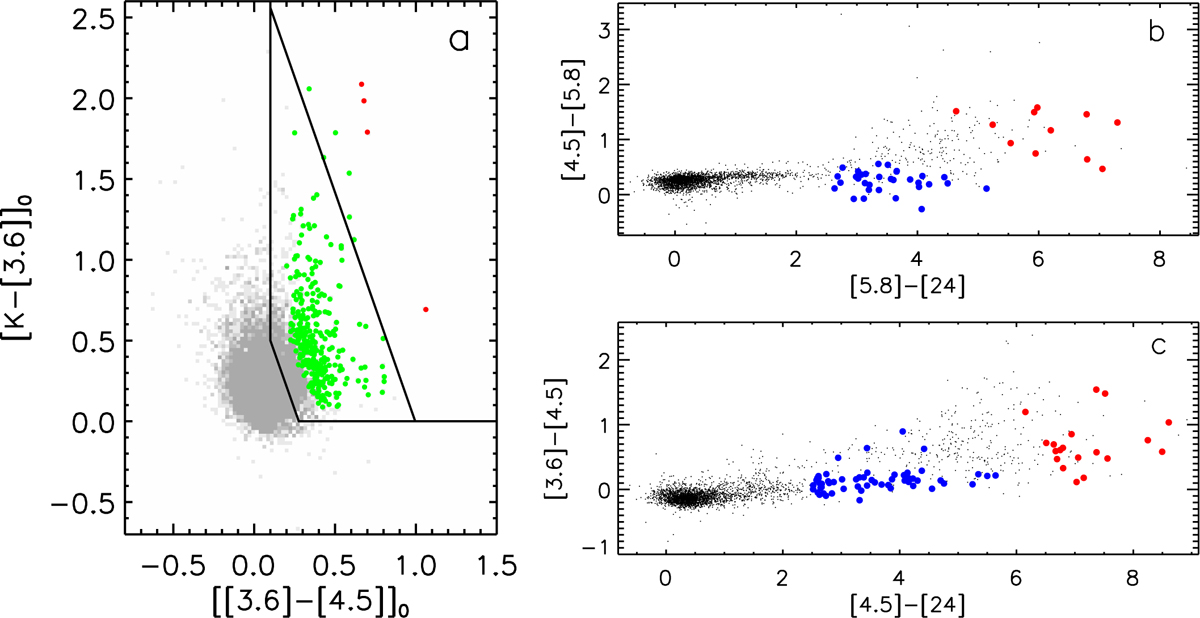
Color–color diagrams used for YSO identification in phase 2 (panel a) and phase 3 (panels b and c) classification schemes suggested by Gutermuth et al. (2009) for an example of GMF 39 (CFG047.06+0.26). The Class I sources identified in phase 2 and the protostars identified in phase 3 are marked with red dots. The Class II sources isolated in phase 2 are labeled with green dots while the transition disks classified in phase 3 are shown with blue dots.
Current usage metrics show cumulative count of Article Views (full-text article views including HTML views, PDF and ePub downloads, according to the available data) and Abstracts Views on Vision4Press platform.
Data correspond to usage on the plateform after 2015. The current usage metrics is available 48-96 hours after online publication and is updated daily on week days.
Initial download of the metrics may take a while.