Fig. C.1.
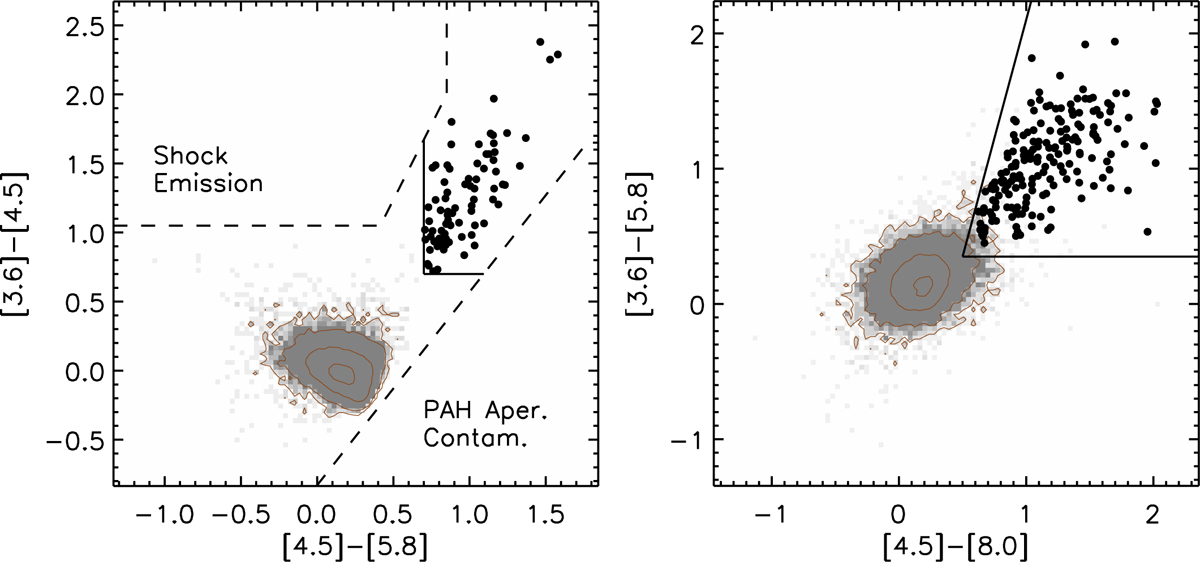
Color–color diagrams used for identification of Class I (left), and Class II (right) sources in phase 1 of the classification scheme presented by Gutermuth et al. (2009) for an example of GMF 39 (CFG047.06+0.26). The black filled circles represent the selected Class I and Class II sources. The remaining Class III/field sources are indicated by the gray dots. The black lines show the color criteria of the classification scheme.
Current usage metrics show cumulative count of Article Views (full-text article views including HTML views, PDF and ePub downloads, according to the available data) and Abstracts Views on Vision4Press platform.
Data correspond to usage on the plateform after 2015. The current usage metrics is available 48-96 hours after online publication and is updated daily on week days.
Initial download of the metrics may take a while.