Fig. 25.
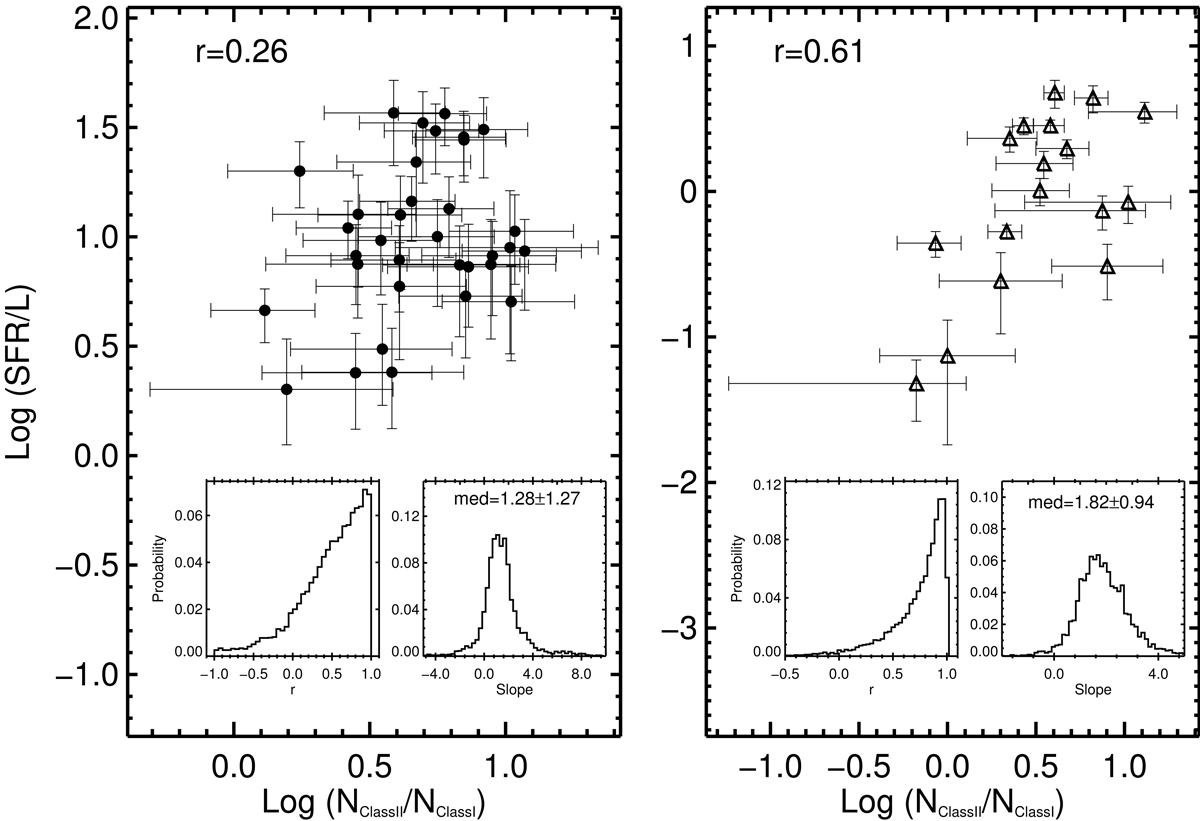
SFR per unit length vs. Class II to Class I YSO fraction for the GMFs (left panel) and the nearby star-forming clouds (right panel). The Pearson r values obtained without considering uncertainty are marked on the top of panels. The inset plots in each panel show the probability distributions of correlations coefficient and fitting slope obtained with Bayesian linear regression method by Kelly (2007).
Current usage metrics show cumulative count of Article Views (full-text article views including HTML views, PDF and ePub downloads, according to the available data) and Abstracts Views on Vision4Press platform.
Data correspond to usage on the plateform after 2015. The current usage metrics is available 48-96 hours after online publication and is updated daily on week days.
Initial download of the metrics may take a while.