Fig. 24.
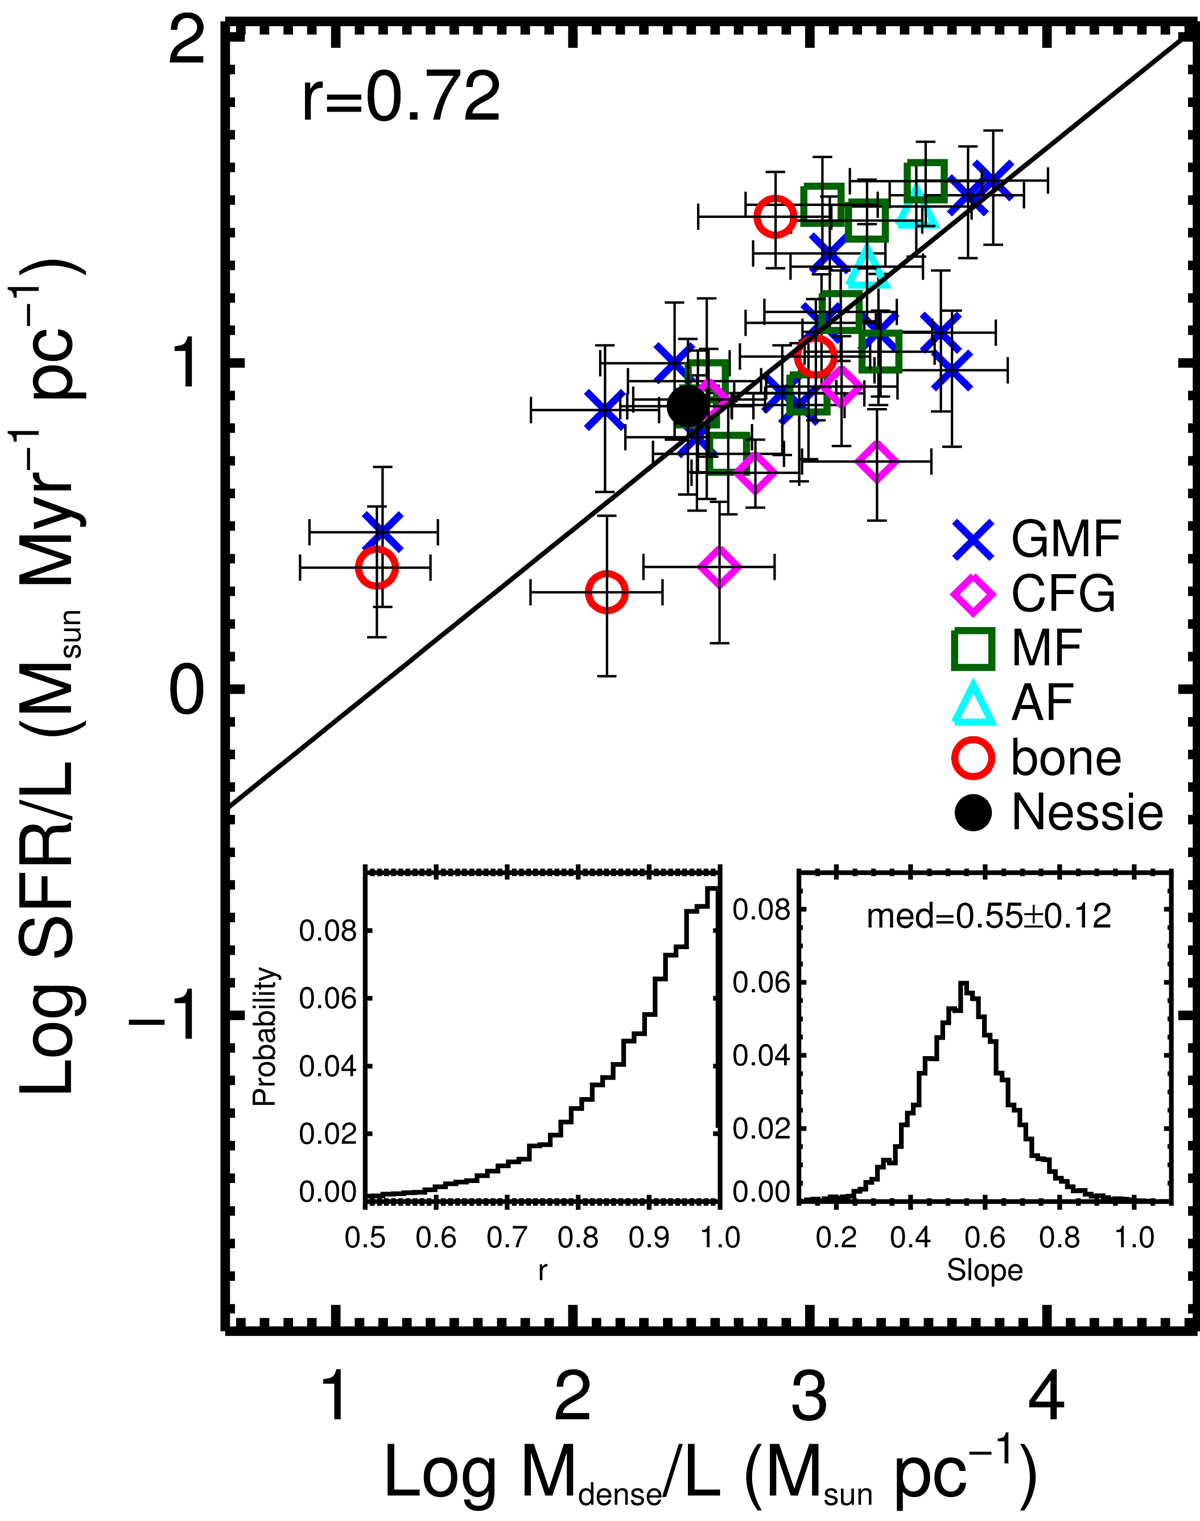
SFR per unit length vs. dense gas mass per unit length for GMFs. GMFs from different original identification publications are marked with different symbols. The abbreviations correspond to the column one of Table 2. The black line shows the linear fittings obtained without considering uncertainties. The Pearson r obtained without considering uncertainties is also marked on the top of the figure. The inset plots show the probability distributions of correlation coefficient and fitting slope obtained with Bayesian linear regression method by Kelly (2007).
Current usage metrics show cumulative count of Article Views (full-text article views including HTML views, PDF and ePub downloads, according to the available data) and Abstracts Views on Vision4Press platform.
Data correspond to usage on the plateform after 2015. The current usage metrics is available 48-96 hours after online publication and is updated daily on week days.
Initial download of the metrics may take a while.