Fig. 22.
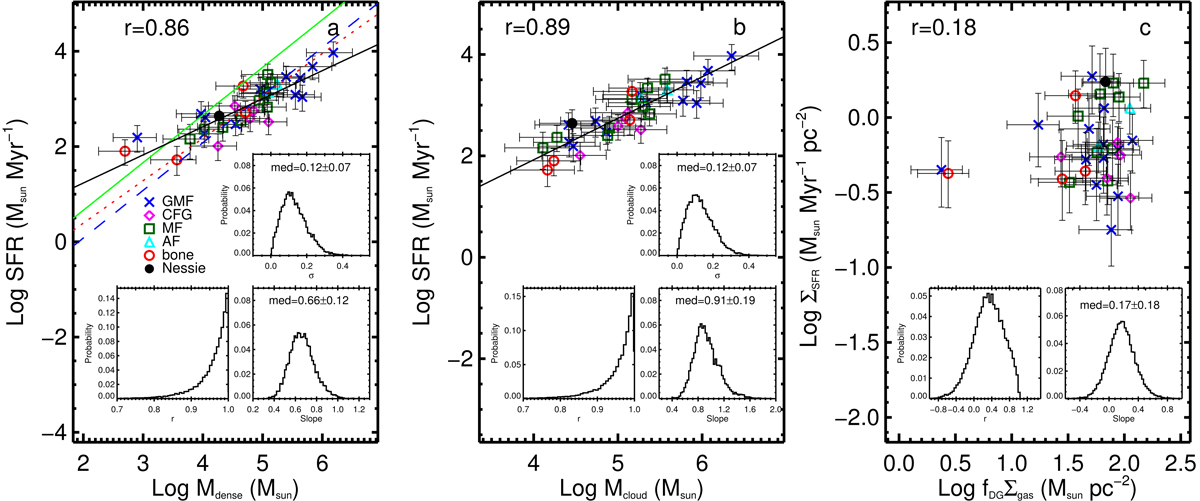
SFR and ΣSFR as a function of dense gas mass (panel a); cloud mass (panel b); and fDGΣgas for GMFs (panel c). The GMFs from different original identification publications are marked with different symbols. The abbreviations correspond to the column one of Table 2. The straight lines represent Lada’s equation (green solid line, Lada et al. 2010), the relation from Wu et al. (2005; blue dashed line), fitting result from Evans et al. (2014; red dotted line), and our linear fitting results without considering uncertainties (black solid line). The Pearson correlation coefficients between the different sets of parameters obtained without considering uncertainties are marked on top region of each panel. The inset plots in each panel show the probability distributions of correlation coefficients (r), fitting slopes, and intrinsic scatters (σ) obtained with Bayesian linear regression method by Kelly (2007).
Current usage metrics show cumulative count of Article Views (full-text article views including HTML views, PDF and ePub downloads, according to the available data) and Abstracts Views on Vision4Press platform.
Data correspond to usage on the plateform after 2015. The current usage metrics is available 48-96 hours after online publication and is updated daily on week days.
Initial download of the metrics may take a while.