Free Access
Fig. 19.
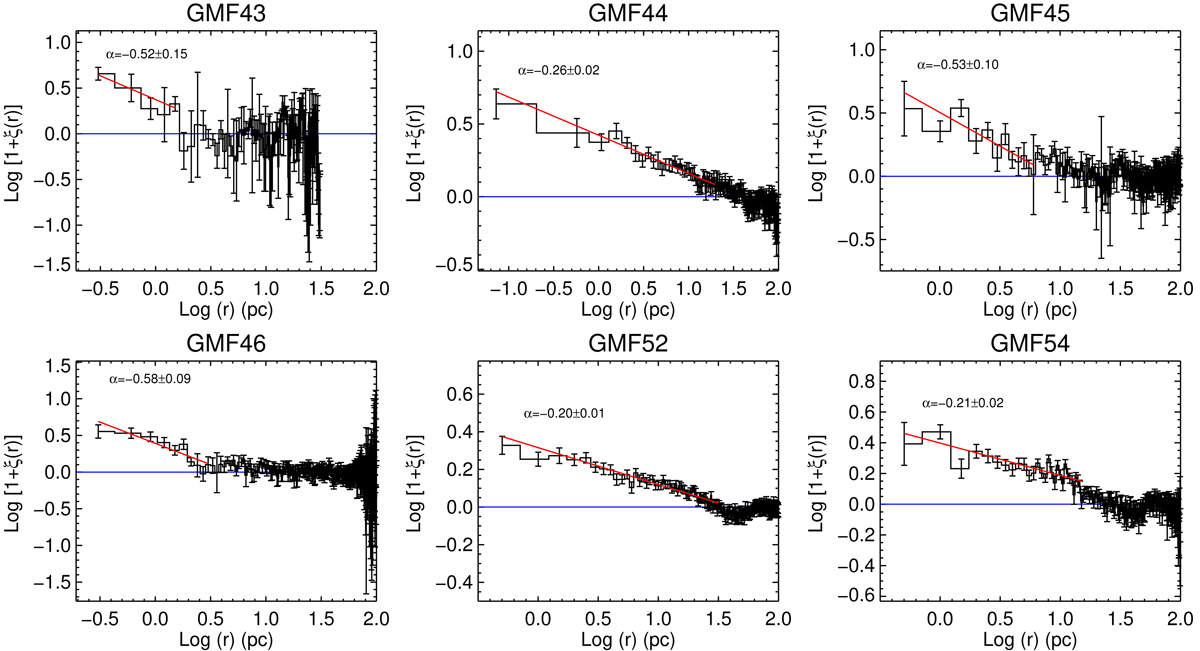
Two-point correlation functions for the Class I sources in 6 GMFs. The title on each panel corresponds to the ID number of Table H.2. The red solid lines show the linear fits to the roughly straight line part of the data and the fitting slopes are labeled in each panel.
Current usage metrics show cumulative count of Article Views (full-text article views including HTML views, PDF and ePub downloads, according to the available data) and Abstracts Views on Vision4Press platform.
Data correspond to usage on the plateform after 2015. The current usage metrics is available 48-96 hours after online publication and is updated daily on week days.
Initial download of the metrics may take a while.