Fig. 18.
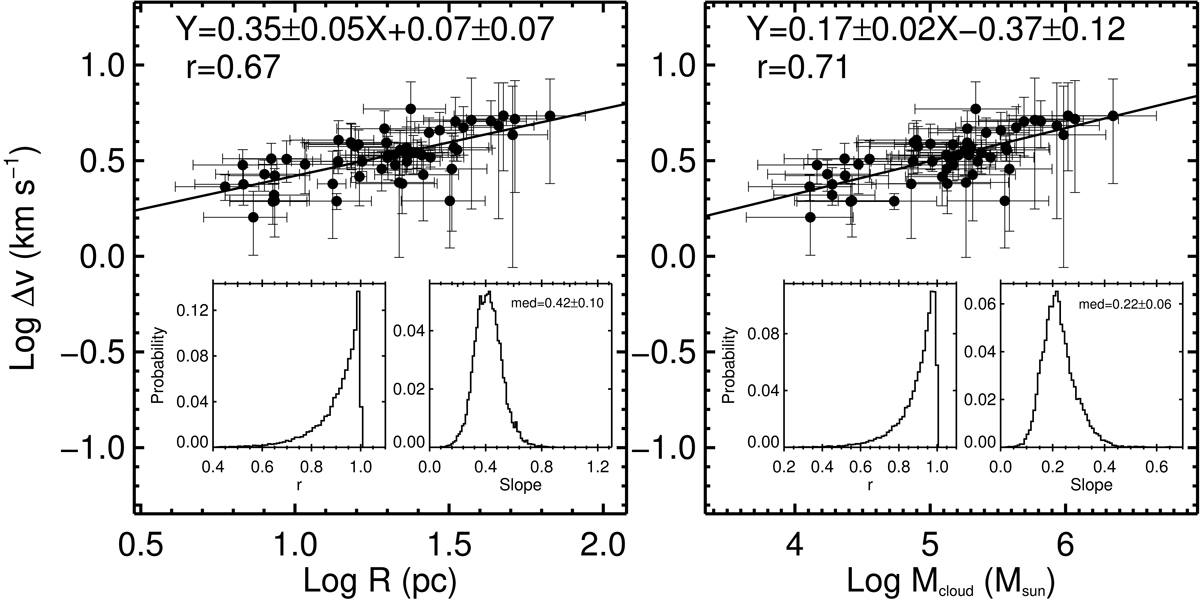
13CO line widths vs. sizes (left panel) and masses (right panel) of the GMFs in log-log plane. The solid lines show the best linear fittings to the points without considering the uncertainties. The correlation coefficients and the fitting results that are obtained without considering the uncertainties are also marked in the top region of panels. The small inset plots in each panel show the probability distributions of correlation coefficients and fitting slopes that are obtained after including uncertainties on both axes using the Bayesian linear regression method developed by Kelly (2007).
Current usage metrics show cumulative count of Article Views (full-text article views including HTML views, PDF and ePub downloads, according to the available data) and Abstracts Views on Vision4Press platform.
Data correspond to usage on the plateform after 2015. The current usage metrics is available 48-96 hours after online publication and is updated daily on week days.
Initial download of the metrics may take a while.