Fig. 13.
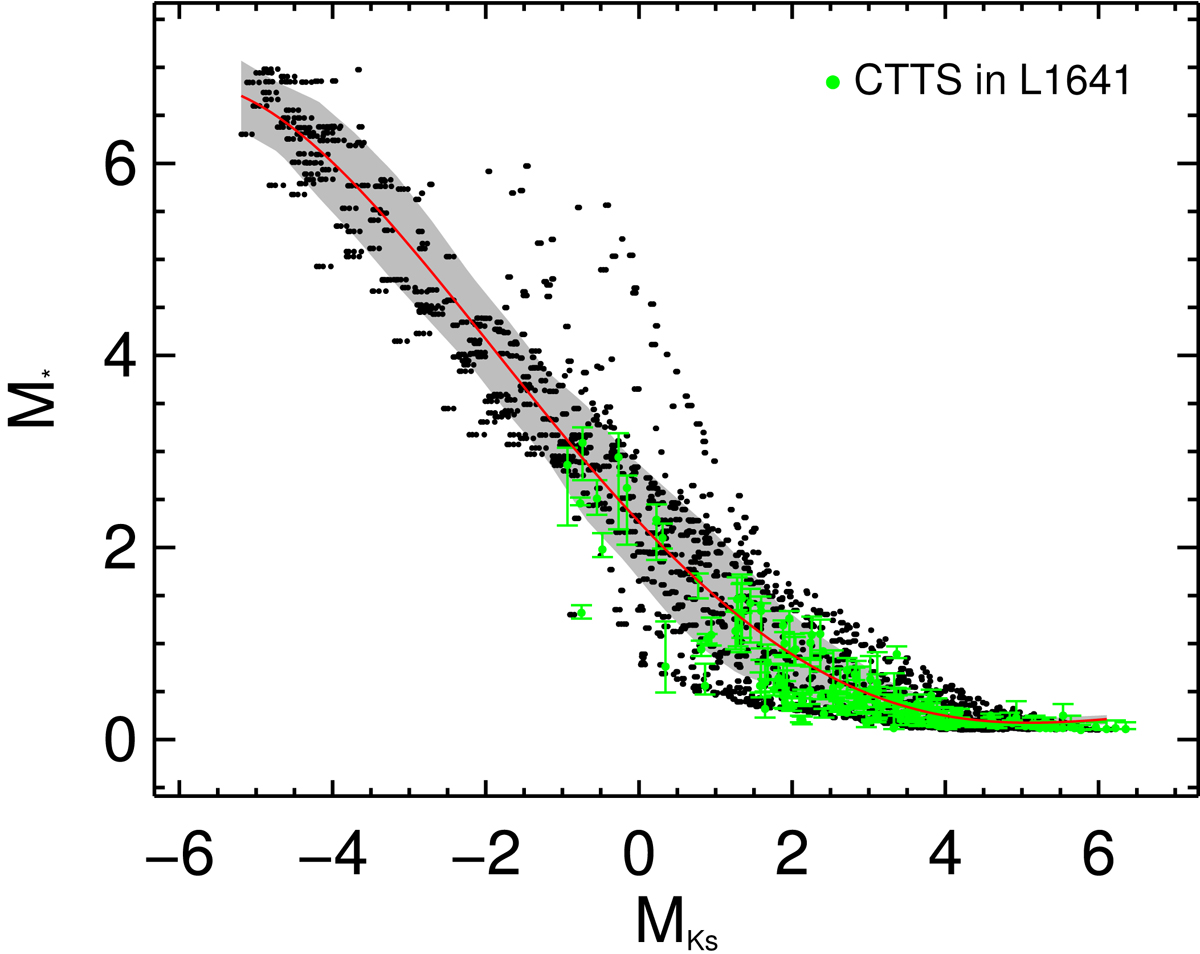
Relation between stellar mass and Ks absolute magnitude of Class II source. The black dots represent the Robitaille et al. (2006) Stage 2 models with 0.001 < Mdisk/M* < 0.01, 0.08 < M* < 7 M⊙, and 30 ° < inclination angle < 60°. The red curve shows the robust polynomial fitting while the gray region shows the 1σ uncertainty of the fitting. The CTTS in L1641 from Fang et al. (2013) are marked with green filled circles.
Current usage metrics show cumulative count of Article Views (full-text article views including HTML views, PDF and ePub downloads, according to the available data) and Abstracts Views on Vision4Press platform.
Data correspond to usage on the plateform after 2015. The current usage metrics is available 48-96 hours after online publication and is updated daily on week days.
Initial download of the metrics may take a while.