Fig. 9.
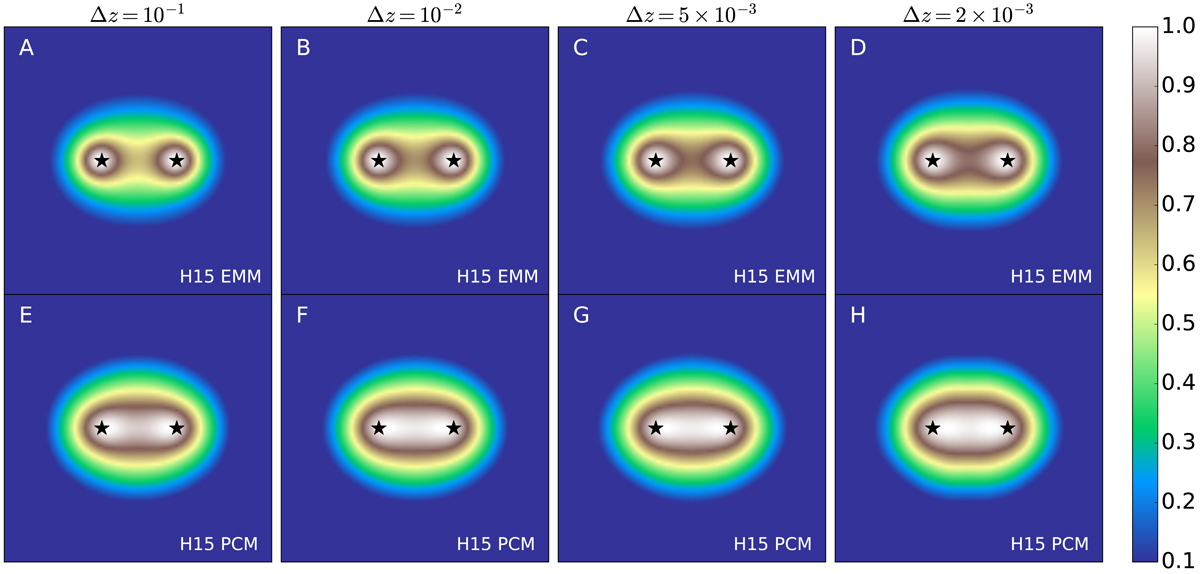
Simulated change in the excess mass (EMM; panels A to D) and pair convergence (PCM; panels E to H) around lens pairs when enriching the level of correlated pairs by further sub-dividing the lens samples into slices with width Δz = 10−1, 10−2, 5 × 10⁻³, 2 × 10⁻³ (left to right). The shear stacks of the slices are combined for the final maps inside the panels. To highlight the relative differences between the maps, all maps are normalised to the maximum signal in the map; the intensity scale varies over the range 10%–100% of the maximum. The maps use the H15 high-z sample and pairs, indicated by the stars, that fall into the close-θ separation bin.
Current usage metrics show cumulative count of Article Views (full-text article views including HTML views, PDF and ePub downloads, according to the available data) and Abstracts Views on Vision4Press platform.
Data correspond to usage on the plateform after 2015. The current usage metrics is available 48-96 hours after online publication and is updated daily on week days.
Initial download of the metrics may take a while.