Fig. 7.
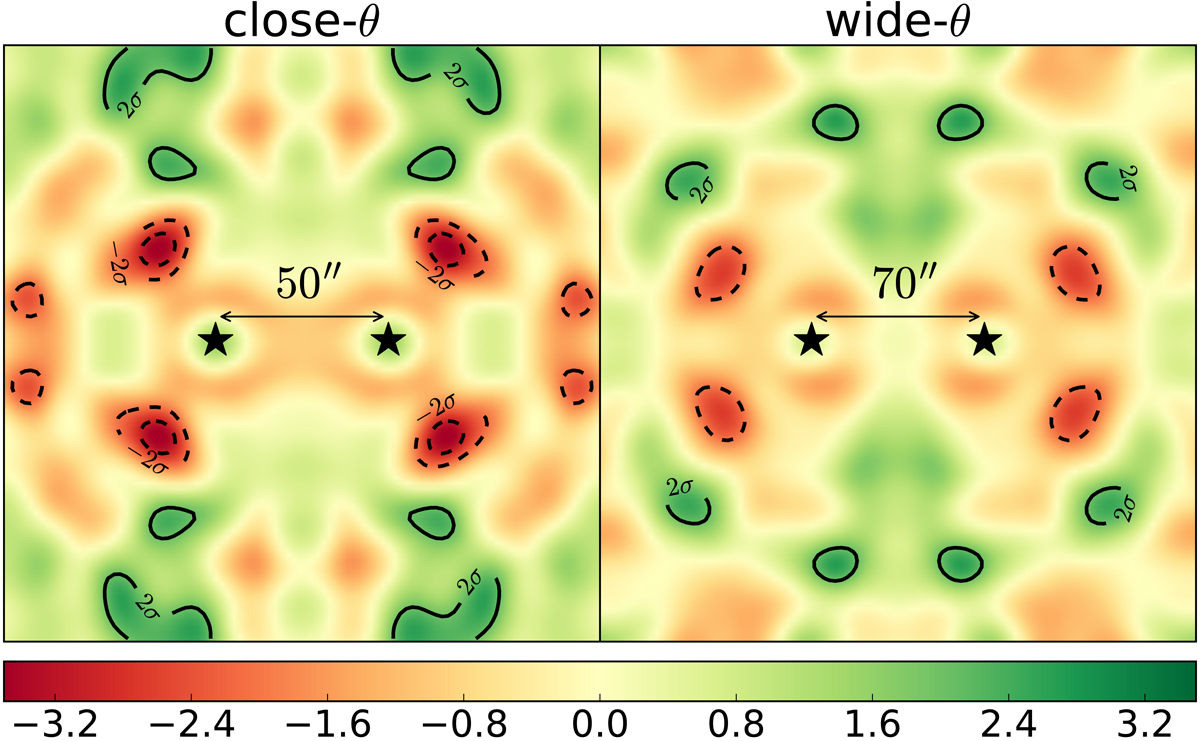
Signal-to-noise ratio of residuals in the CFHTLenS excess mass after subtraction of the shear stacks from the H15 model predictions (E-mode). To increase the significance in both maps, we combine the residual signals from the low-z and high-z samples for the same angular separation. The contours indicate regions of 2σ or 3σ significance; dashed lines are for negative residuals. Left panel: model residuals for the combined close-θ separation bin. Right panel: model residuals for the wide-θ separation bin.
Current usage metrics show cumulative count of Article Views (full-text article views including HTML views, PDF and ePub downloads, according to the available data) and Abstracts Views on Vision4Press platform.
Data correspond to usage on the plateform after 2015. The current usage metrics is available 48-96 hours after online publication and is updated daily on week days.
Initial download of the metrics may take a while.