Fig. 6.
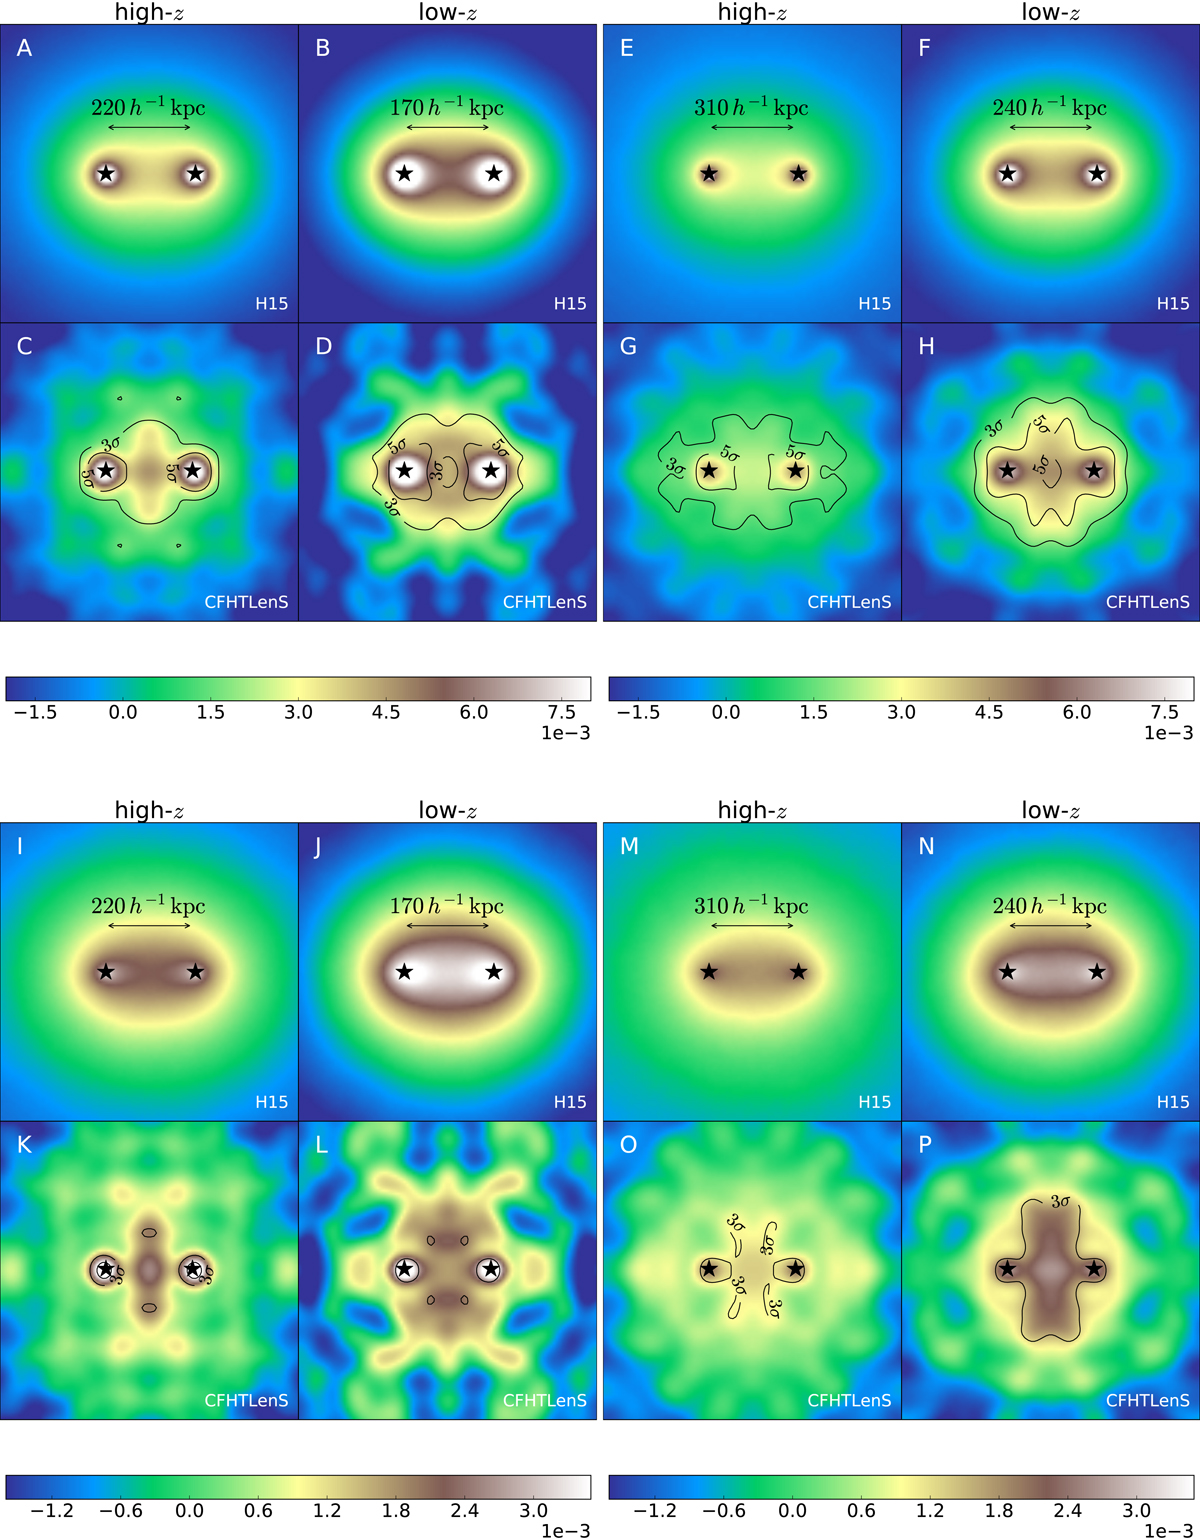
Comparison of the E-mode excess mass (panels A–H) and the pair convergence (panels I–P) between CFHTLenS data (from shear stacks) and the H15 model (from convergence stacks). The maps are arranged in bins of lens redshifts (columns) and projected angular separations of lenses. The mean angular separations for close-θ and wide-θ lenses are converted into projected distances and quoted inside the panels. The lens positions are indicated by stars. The contour lines indicate the significance levels 3σ and 5σ for the CFHTLenS measurements.
Current usage metrics show cumulative count of Article Views (full-text article views including HTML views, PDF and ePub downloads, according to the available data) and Abstracts Views on Vision4Press platform.
Data correspond to usage on the plateform after 2015. The current usage metrics is available 48-96 hours after online publication and is updated daily on week days.
Initial download of the metrics may take a while.