Fig. 5.
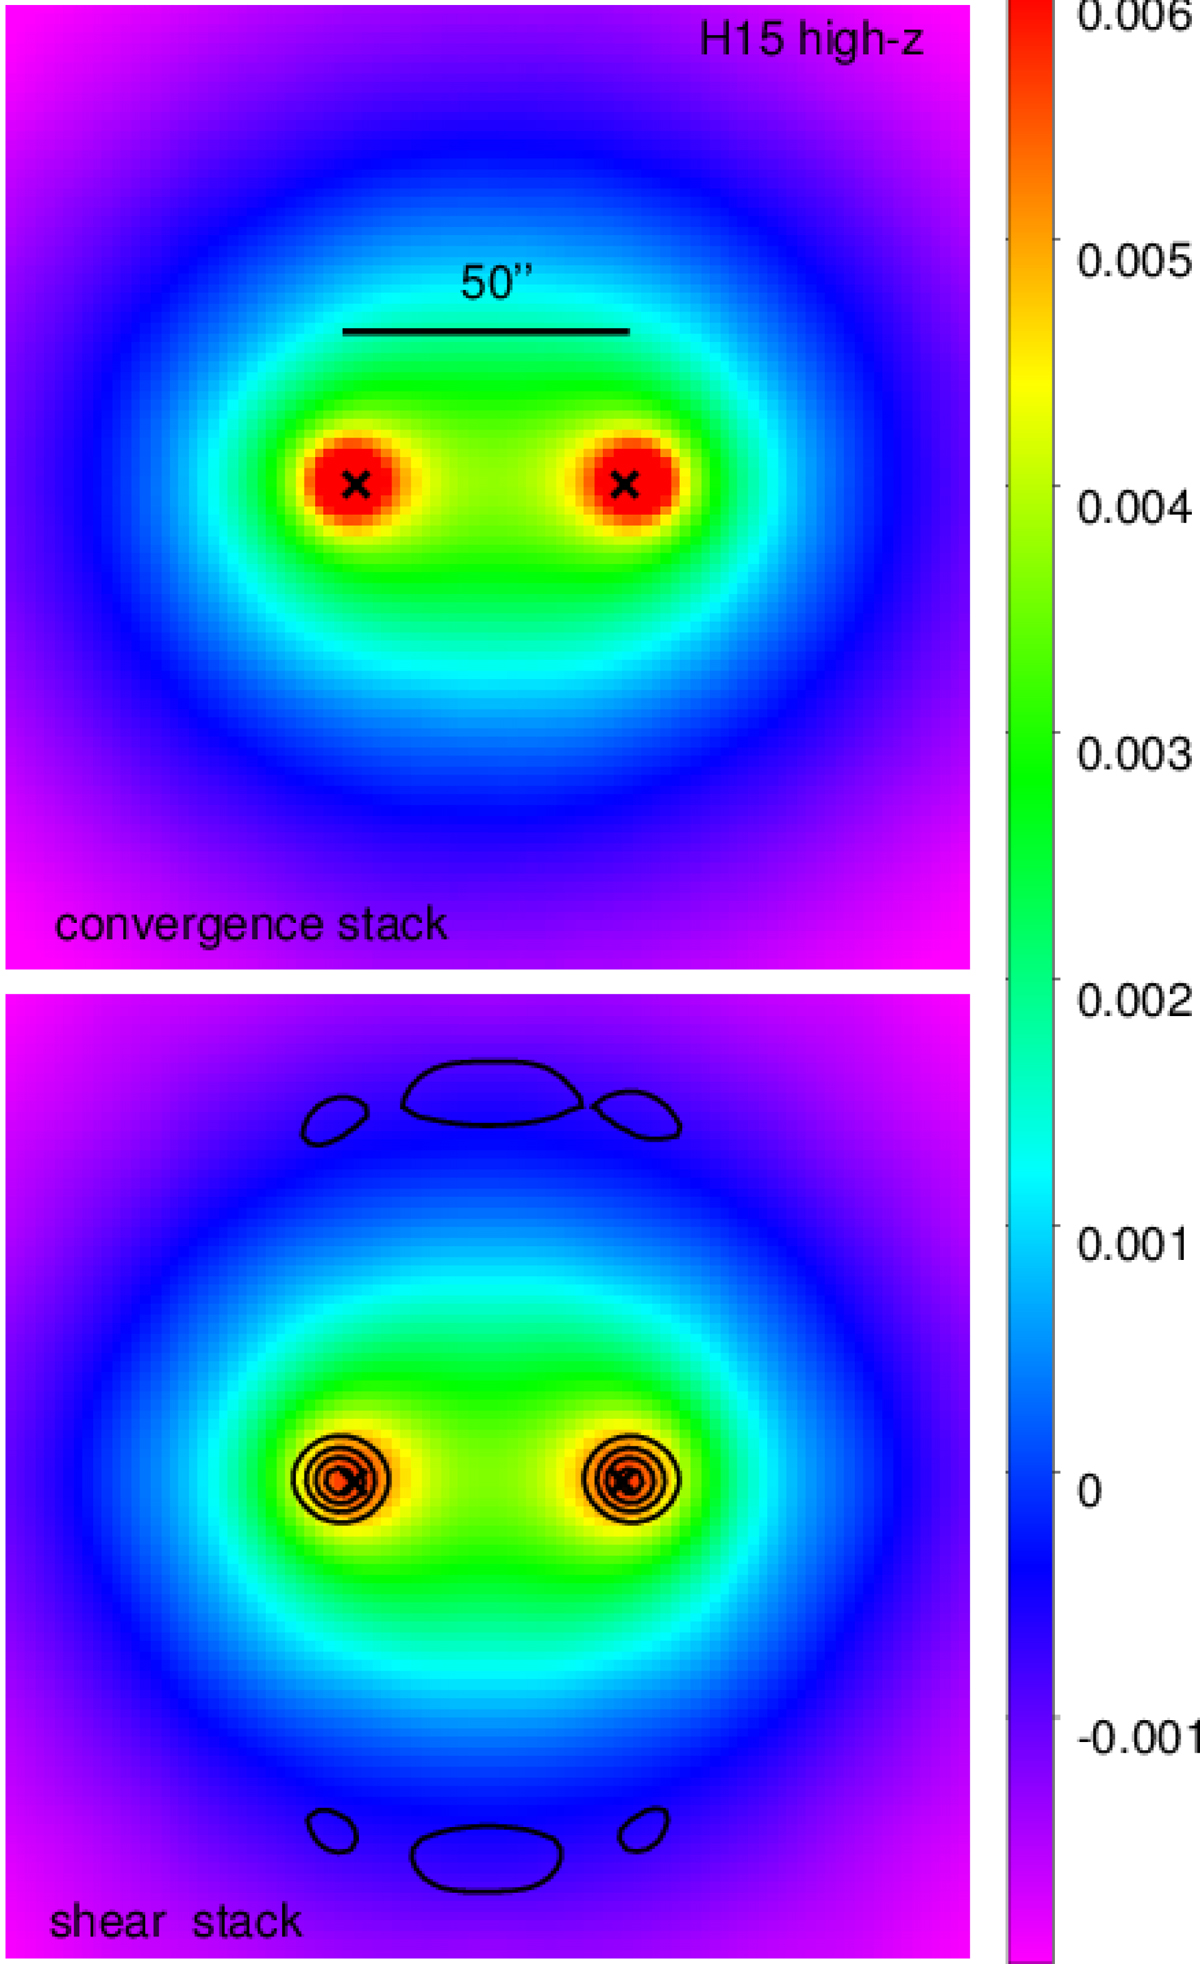
Verification test with simulated data: a comparison of the E-mode excess mass ![]() (intensity scale) obtained from the 1024 deg2 mock data with two different method. The lens pairs are selected from the separation interval close-θ and redshift bin high-z (z̅d ≈ 0.52). The lens positions inside the map are indicated by crosses. The shape and sampling noise of the sources are negligible here. Top panel: explicit stacking of the convergence on a grid; only applied to the simulated data. Bottom panel: reconstruction with a shear stack as applied to our CFHTLenS data. The contours show the relative difference
(intensity scale) obtained from the 1024 deg2 mock data with two different method. The lens pairs are selected from the separation interval close-θ and redshift bin high-z (z̅d ≈ 0.52). The lens positions inside the map are indicated by crosses. The shape and sampling noise of the sources are negligible here. Top panel: explicit stacking of the convergence on a grid; only applied to the simulated data. Bottom panel: reconstruction with a shear stack as applied to our CFHTLenS data. The contours show the relative difference ![]() between the two methods
between the two methods ![]() (top) and
(top) and ![]() (bottom) in steps of 10%, 20%, etc. for regions where the signal magnitude is above 5 × 10⁻⁴.
(bottom) in steps of 10%, 20%, etc. for regions where the signal magnitude is above 5 × 10⁻⁴.
Current usage metrics show cumulative count of Article Views (full-text article views including HTML views, PDF and ePub downloads, according to the available data) and Abstracts Views on Vision4Press platform.
Data correspond to usage on the plateform after 2015. The current usage metrics is available 48-96 hours after online publication and is updated daily on week days.
Initial download of the metrics may take a while.