Fig. 4.
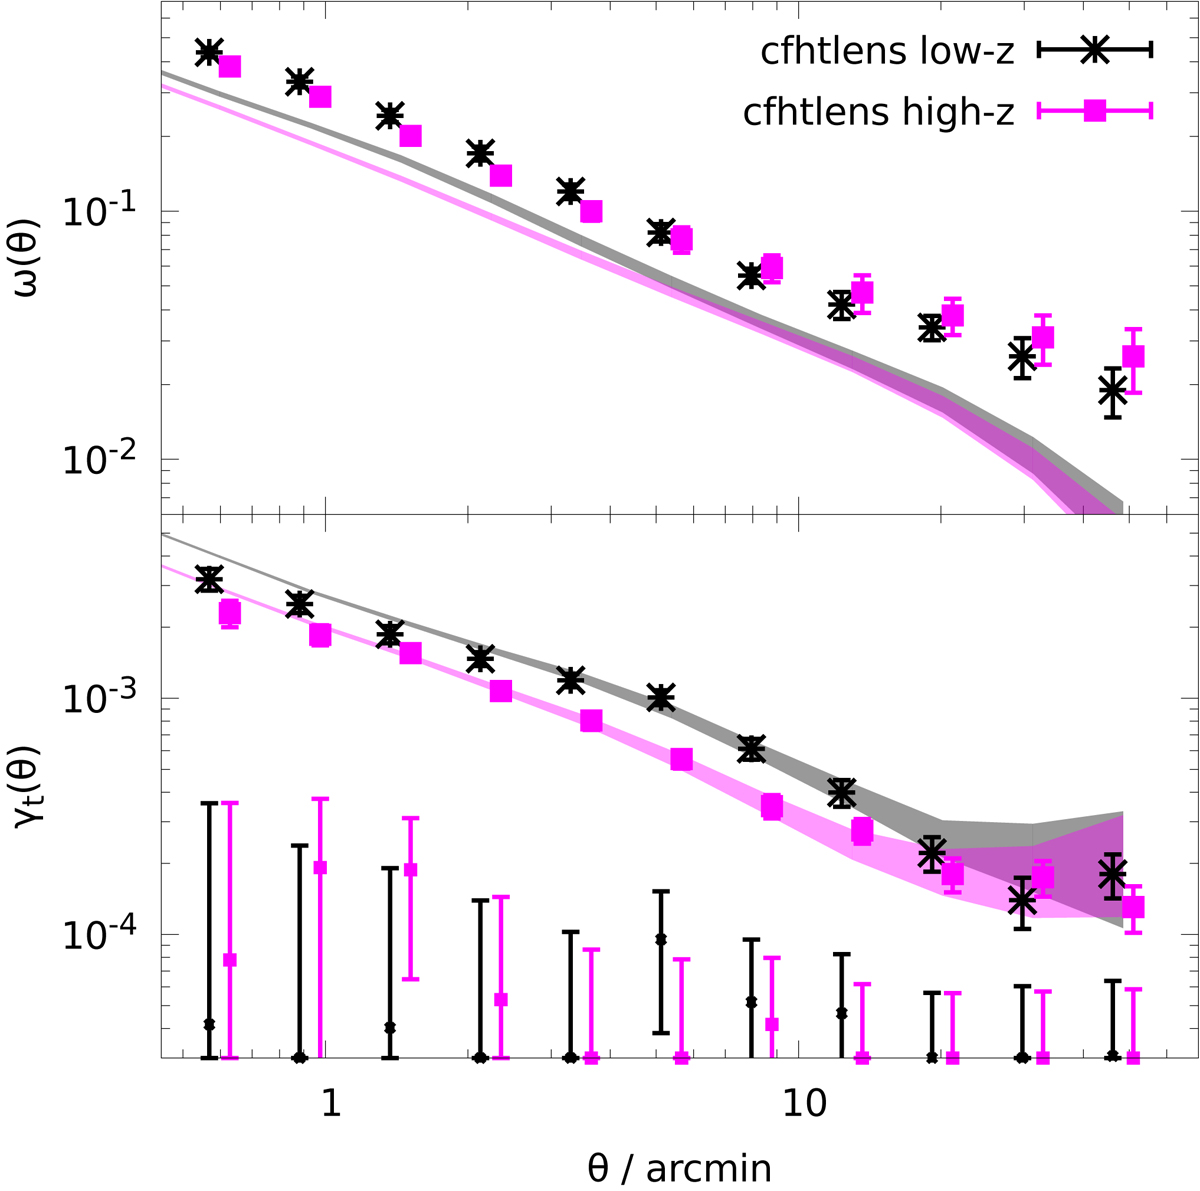
Angular clustering (top panel) and mean tangential shear (bottom panel) of our different lens samples. The large data points show the CFHTLenS measurements for the low-z (stars) and high-z sample (squares) with 1σ error bars, and the coloured regions are 2σ predictions based on the H15 mocks. The grey regions are the predictions for the low-z samples, the magenta regions predict the amplitude of the high-z samples. The small data points with large errors bars at the bottom of the lower panel are the absolute values of the mean cross-shear for the CFHTLenS lenses.
Current usage metrics show cumulative count of Article Views (full-text article views including HTML views, PDF and ePub downloads, according to the available data) and Abstracts Views on Vision4Press platform.
Data correspond to usage on the plateform after 2015. The current usage metrics is available 48-96 hours after online publication and is updated daily on week days.
Initial download of the metrics may take a while.