Free Access
Fig. A.3.
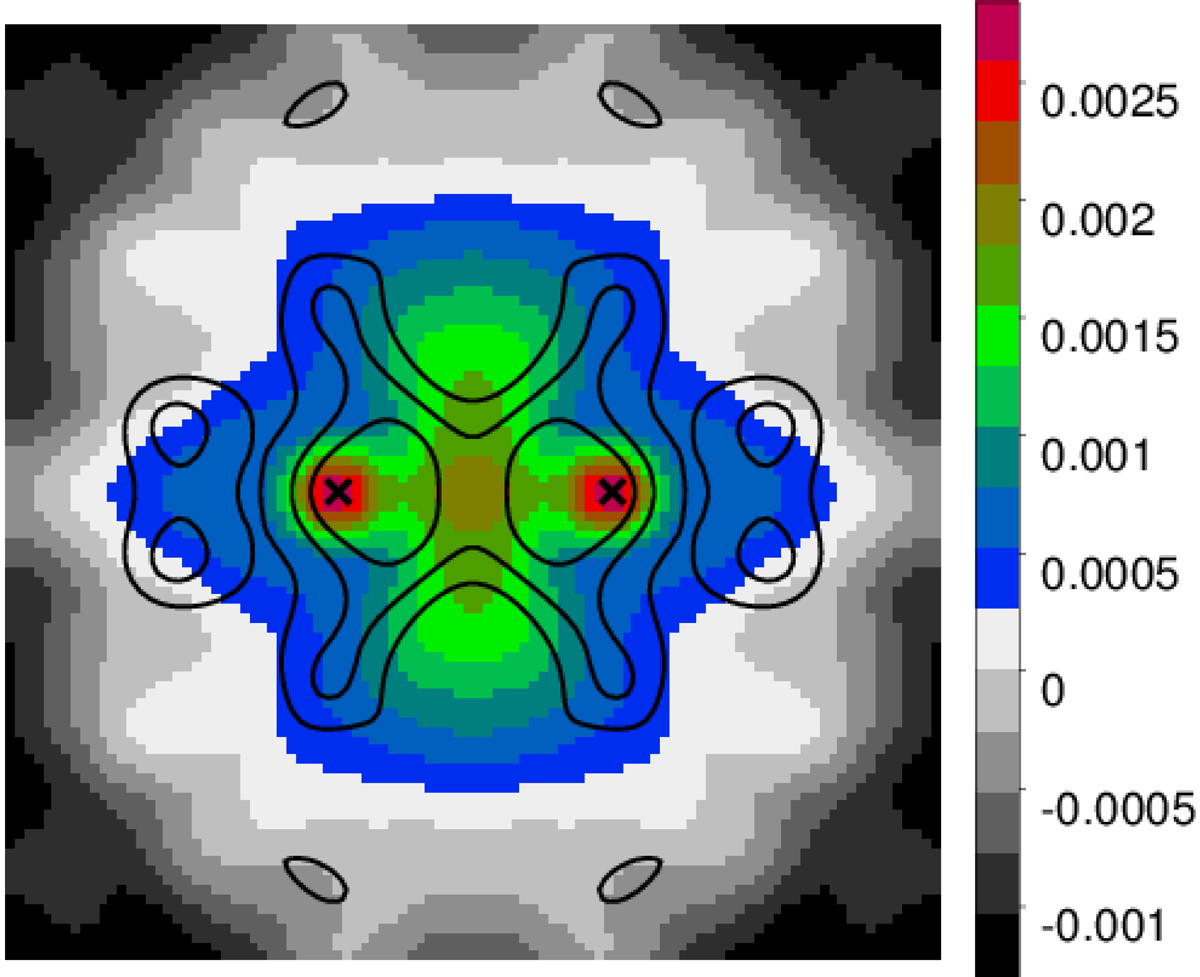
Average of all pair-convergence maps in Fig. 6, panels K, L, O, and P, and the corresponding B-mode maps by combining all shear stacks used for that figure. The E-mode is shown here as intensity scale, the B-mode is shown as overlay of iso-contours for the levels 2 × 10⁻⁴, 4 × 10⁻⁴, and 6 × 10⁻⁴.
Current usage metrics show cumulative count of Article Views (full-text article views including HTML views, PDF and ePub downloads, according to the available data) and Abstracts Views on Vision4Press platform.
Data correspond to usage on the plateform after 2015. The current usage metrics is available 48-96 hours after online publication and is updated daily on week days.
Initial download of the metrics may take a while.