Fig. A.2.
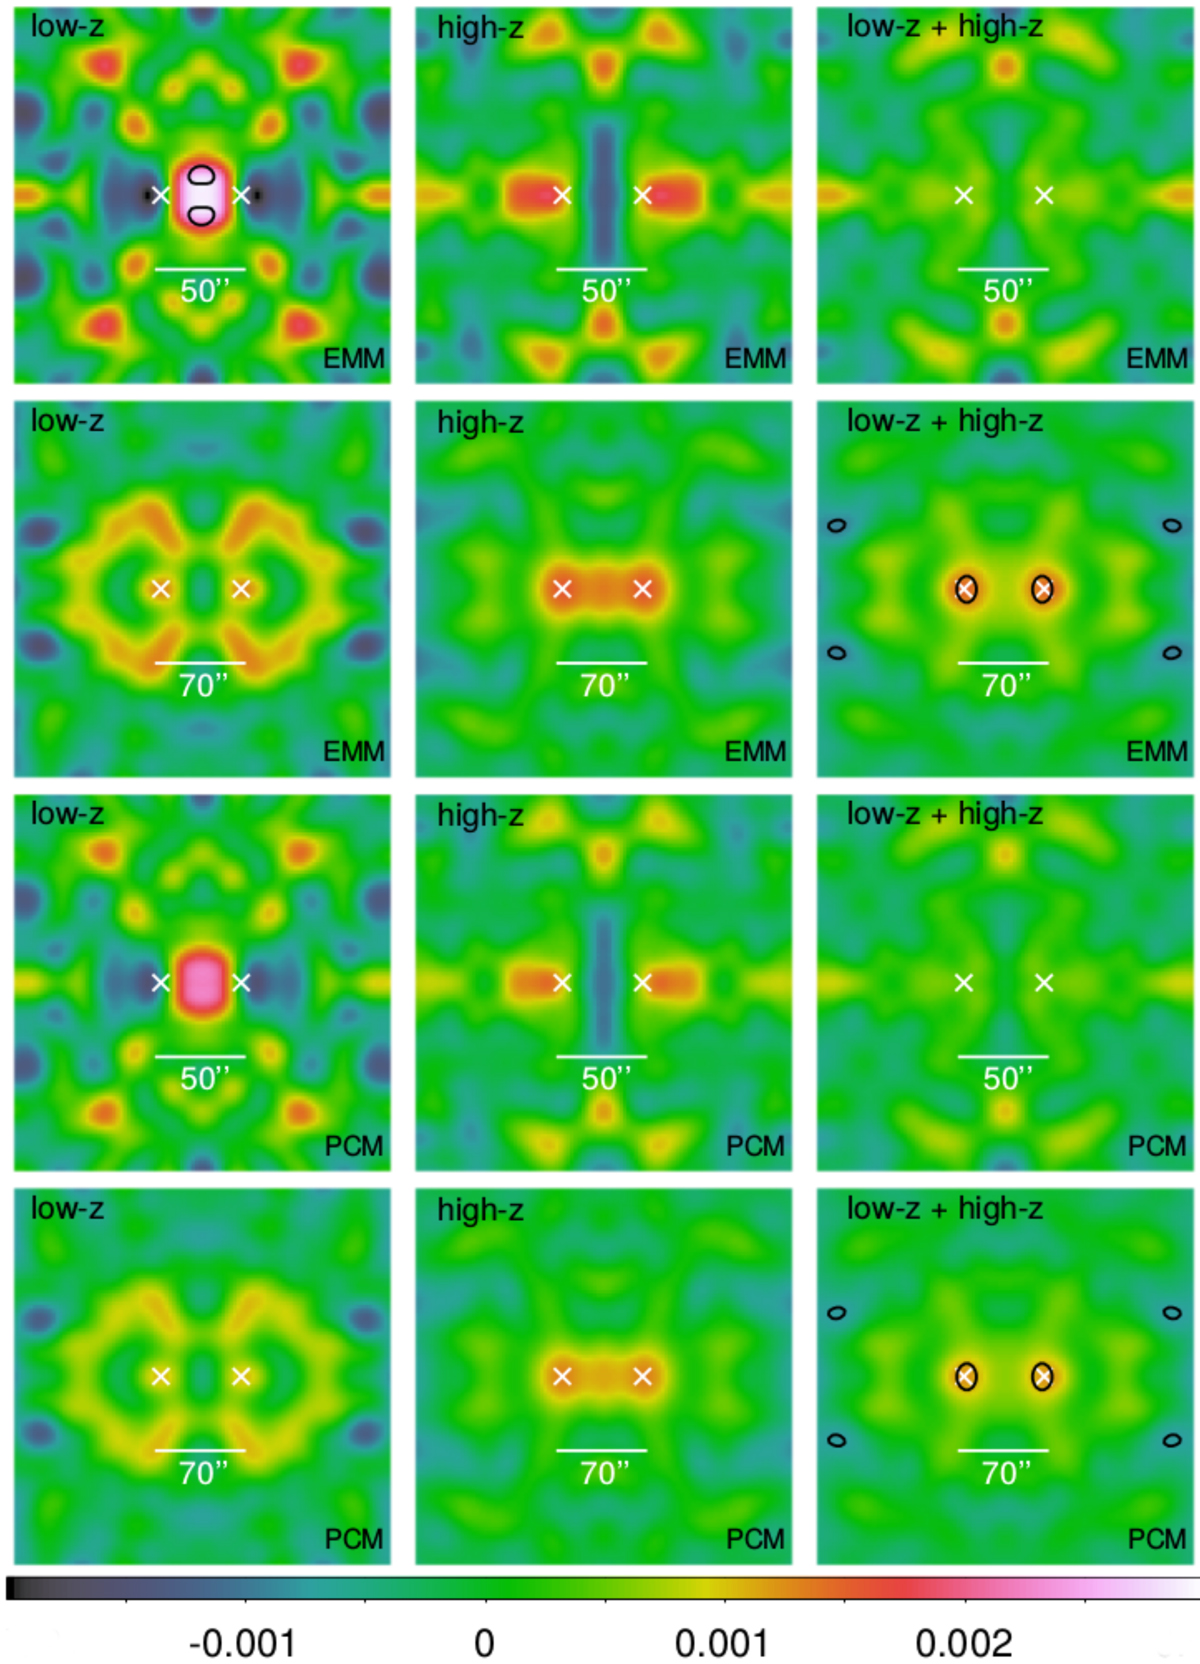
B-mode maps of the excess mass around CFHTLenS galaxy pairs for the excess mass (top panels) and the pair convergence (bottom panels). The angular scale and redshift selections are indicated inside the panels. The crosses show the lens positions inside the map. The contours indicate regions with significance greater or equal 3σ.
Current usage metrics show cumulative count of Article Views (full-text article views including HTML views, PDF and ePub downloads, according to the available data) and Abstracts Views on Vision4Press platform.
Data correspond to usage on the plateform after 2015. The current usage metrics is available 48-96 hours after online publication and is updated daily on week days.
Initial download of the metrics may take a while.