| Issue |
A&A
Volume 622, February 2019
|
|
|---|---|---|
| Article Number | A53 | |
| Number of page(s) | 21 | |
| Section | Galactic structure, stellar clusters and populations | |
| DOI | https://doi.org/10.1051/0004-6361/201629898 | |
| Published online | 28 January 2019 | |
Formation of globular clusters with multiple stellar populations from massive gas clumps in high-z gas-rich dwarf galaxies★
ICRAR, M468, The University of Western Australia, 35 Stirling Highway,
Crawley,
WA
6009,
Australia
e-mail: This email address is being protected from spambots. You need JavaScript enabled to view it.
Received:
14
October
2016
Accepted:
6
March
2018
Abstract
Context. One of the currently favored scenarios for the formation of globular clusters (GCs) with multiple stellar populations is that an initial massive stellar system forms (“first generation”, FG), subsequently giving rise to gaseous ejecta which is converted into a second-generation (SG) of stars to form a GC. How such GCs with such FG and SG populations form and evolve, however, remains unclear.
Aims. We therefore investigate, for the first time, the sequential formation processes of both FG and SG stars from star-forming massive gas clumps in gas-rich dwarf disk galaxies.
Methods. We adopt a novel approach to resolve the two-stage formation of GCs in hydrodynamical simulations of dwarf galaxies. In the new simulations, new gas particles that are much less massive than their parent star particle are generated around each new star particle when the new star enters into the asymptotic giant branch (AGB) phase. Furthermore, much finer maximum time step width (~105 yr) and smaller softening length (~2 pc) are adopted for such AGB gas particles to properly resolve the ejection of gas from AGB stars and AGB feedback effects. Therefore, secondary star formation from AGB ejecta can be properly investigated in galaxy-scale simulations.
Results. An FG stellar system can first form from a massive gas clump developing due to gravitational instability within its host gas-rich dwarf galaxy. Initially the FG stellar system is not a single massive cluster, but instead is composed of several irregular stellar clumps (or filaments) with a total mass larger than 106 M⊙. While the FG system is dynamically relaxing, gaseous ejecta from AGB stars can be gravitationally trapped by the FG system and subsequently converted into new stars to form a compact SG stellar system within the FG system. Interestingly, about 40% of AGB ejecta is from stars that do not belong to the FG system (“external gas accretion”). FG and SG stellar systems have different amplitudes of internal rotation and V∕σ. The mass-density (MSG−ρSG) relation for SG stellar systems can be approximated as ρSG ∝ MSG1.5. There can be a threshold total mass of GC host galaxies (Mth = [5 − 23] × 109 M⊙) beyond which the formation of GCs with compact SG stellar systems is possible. Both the initial baryonic mass fraction and the gas mass fraction in dwarfs are crucial parameters that determine whether or not GCs can contain multiple stellar populations. GCs with compact SG stellar systems are more likely to form in dwarf disks with larger gas mass fractions and higher surface mass densities. Formation of binary GCs with SGs and the subsequent GC merging are clearly seen in some models. The derived external gas-accretion process in FG systems initially consisting of stellar clumps will need to be investigated further in more sophisticated simulations.
Key words: galaxies: star clusters: general / galaxies: evolution / stars: formation
The movies are available at http://www.aanda.org
© ESO 2019
1 Introduction
A growing number of recent photometric and spectroscopic observations of the Galactic globular clusters (GCs) reveal strong evidence for the presence of multiple stellar populations in GCs (e.g., Bedin et al. 2004; Piotto et al. 2005, 2007; Milone et al. 2009; Gratton et al. 2013; see Gratton et al. 2012, GCB12, for a recent review). One key recent observation is that the majority (~70%) of stellar populations in GCs are so-called “second generations” (SGs) of stars which form from gas ejecta from stars of an earlier generation (often referred to as first-generation (FG) stars; e.g., Carretta et al. 2010a). The observed large fraction of SG stars and Na-O and C-N anti-correlations between these stars have had a significant impact on theoretical studies of GC formation and have accordingly prompted a more sophisticated and realistic modeling of GC formation (e.g., D’Ercole et al. 2008, D08). Recent observational studies on possible differences in physical properties (e.g., radial distributions and kinematics) between FG and SG stars have provided new valuable constraints on the formation processes of GCs with multiple stellar populations (e.g., Sollima et al. 2007; Bellini et al. 2009; D’Orazi et al. 2010; Mackey et al. 2013).
The degrees of abundance inhomogeneity in GCs with multiple stellar populations are observed to be diverse (GCB12; Marino et al. 2011, 2012, 2015; Johnson et al. 2015). At least eight Galactic GCs have been demonstrated to have metallicity spread (not just abundance spread in light elements), and some of them show abundance spread even in s-process elements (e.g., Marino et al. 2015), which implies that both Type II supernovae (SNe) and asymptotic giant branch (AGB) stars might have possibly polluted the early chemical evolution of GCs. The two metallicity groups in M22 have significantly different [Ba/Fe], [Y/Fe], [La/Fe], and [La/Eu] (e.g., Marino et al. 2011), which provides strong constraints both on the s-process enrichment process of forming GCs and on the chemical yields of AGB stars (e.g., Shingles et al. 2014). Carretta (2015) recently discovered five distinct stellar populations in NGC 2808, which implies that there are more than just two major star formation epochs, as was modeled in previous theoretical studies of GCs with multiple stellar populations (e.g., D08). The observed variety of multiple stellar populations in the Galactic GCs needs to be explained by a theoretical model of GC formation.
One of the possible GC formation scenarios in recent observational and theoretical works related to multiple stellar populations of GCs implies that the original GCs were much more massive than the present-day ones (e.g., Renzini et al. 2015). In this scenario, massive stellar systems with total masses approximately 10 times larger than the present typical GC mass of 2 × 10⁵ M⊙ were first formed fromgas clouds. Numerous massive rotating stars (e.g., Decressin et al. 2007; Krause et al. 2013) or AGB stars (e.g., D’Antona&Caloi 2004; D08) in the FG stellar systems ejected gas from which SG stars were formed. The main observational fact on which this “two-stage” GC formation scenario is based is that the mass fractions of SG stars in the Galactic GCs are as large as 50− 80% (e.g., D’Antona & Caloi 2008; Carretta et al. 2009; GCB12). It is still unclear in this scenario whether it is gaseous ejecta from massive rotating or AGB stars that is responsible for the formation of SG stars in GCs. Bastian et al. (2013) recently proposed that accretion of gas from interacting massive binary and rapidly rotating stars onto circumstellar disks of low-mass pre-main sequence stars is responsible for the origin of multiple stellar populations of GCs. In this scenario, there is no age difference (thus no “FG–SG dichotomy”) between multiple stellar populations of GCs, which is quite different from other models such as D08.
Previous numerical simulations of GC formation demonstrated that SG stars can form from AGB ejecta of FG stars in the central regions of forming GCs (D08; Bekki 2011; B11). These previous theoretical works mainly investigated SG formation from ejecta of FGstars in fixed or live gravitational potentials of already existing FG stellar systems in GCs. Recent simulations investigated SG formation in molecular clouds with fractal structures; however, they did not include galaxy-scale hydrodynamics in a self-consistent manner (Bekki 2017a,b). Furthermore, the mixing of AGB ejecta from FG stars and pristine gas from their host galaxy, which is essential for the observed Na-O anti-correlation (e.g., D08), was ignored in these previous simulations. Therefore, it remains unclear (i) how FG stars form and evolve at the epoch of GC formation within their host galaxies and (ii) how AGB ejecta can be mixed with cold interstellar medium of their host dwarfs in these previous works. Dynamical evolution of GCs with both FG and SG stars with initially different spatial distributions and kinematics have just recently begun to be investigated (e.g., Vesperini et al. 2010, 2013), and the results have important implications both for the long time evolution of GCs and for the origin of the Galactic stellar halo (e.g., Vesperini et al. 2010). It is thus important for theoretical studies of GC formation to predict initial dynamical properties of GCs.
Although previous galaxy-scale and cosmological simulations have tried to identify the possible formation sites of GCs in galaxies (e.g., Bekki & Couch 2001; Bekki et al. 2002; Bromm & Clarke 2002; Kravtsov & Gnedin 2005; Saitoh et al. 2011; Kruijssen et al. 2012; Renaud et al. 2015), the SG star content of the identified “GC” candidates was not investigated: they may or may not be genuine GCs. Semi-analytic models of galaxy formation based on a cold dark matter (CDM) cosmology assumed GC formation in galactic building blocks (e.g., dwarf galaxies) at high redshifts in order to investigate the origin ofphysical properties of GC systems in galaxies (e.g., Beasley et al. 2002; Bekki et al. 2008; Griffen et al. 2010; Tonini 2013). Elmegreen et al. (2012) have recently proposed that high-redshift dwarf galaxies with strong Lyα emission (≥ 1042 erg s−1) are the formation sites of metal-poor GCs. It is not understood, however, in what physical conditions genuine GCs with both FG and SG stars can be formed in galactic building blocks at high redshifts in these studies. Therefore, it remains theoretically unclear (i) how FG stars were formed and evolved within forming GCs and (ii) whether or not GCs with multiple stellar populations can really be formed within galaxies; see Forbes et al. (2018) for more details of the open questions related to GC formation inthe early universe.
The purpose of this paper is therefore to investigate the formation processes of both FG and SG stars in GCs by using self-consistent numerical simulations of GC formation. We develop our new simulation code that is specially purposed to investigate star formation from gas ejected from AGB stars in FG stellar systems of forming GCs. By using this new code, we investigate the following five points in particular: (i) how FG stellar systems can be formed in the early phase of GC formation, (ii) whether and in what physical conditions compact SG stellar systems can be formed during GC formation, (iii) what different physical properties FG and SG stellar systems have that can be observed, (iv) what roles of AGB stars and Type II supernovae (SNII) can play in the formation of FG and SG stellar systems, and (v) what physical properties of a galaxy are required for the galaxy to host GCs with SG stars. Since our new code does not include full chemical yields both from SNe and AGB stars self-consistently, we do not discuss the origin of the observed Na-O and Mg-Al anti-correlations between cluster stars (e.g., Carretta et al. 2009, 2010a) in the present study.
In these investigation, we assume that most GCs with multiple stellar populations were initially formed in gas-rich, actively star-formingdwarf galaxies at high redshifts, which have been considered to be the building blocks of luminous galaxies like our Milky Way (e.g., Searle & Zinn 1978). This assumption is fairly reasonable and realistic for the following reasons. First, some dwarf galaxies in the Local Group and nearby galaxy groups are observed to have old and relatively young GCs (e.g., Georgiev et al. 2009; van den Bergh 2010). Second, the Large Magellanic Cloud (LMC), which is classified as a dwarf irregular galaxy is observed to show possible evidence of multiple stellar populations, such as extended main sequence turn-off morphologies, age spreads, and the presence of young stellar objects within clusters (e.g., Mackey et al. 2008; Mucciarelli et al. 2009; Keller et al. 2012; For & Bekki 2015; Li et al. 2016, FB17; Milone et al. 2017). Third, previous and recent semi-analytic models based on a CDM cosmology assumed that metal-poor GCs can be formed in massive dwarf galaxies in order to explain the key physical properties of galactic GC systems such as metallicity distribution functions of GCs and correlations between GC host luminosities and mean GC metallicities (e.g., Beasley et al. 2002). We thus extensively investigate GC formation processes within dwarf galaxies with different total masses, gas mass fractions, and baryonic mass fractions to clarify the physical conditions required for GC formation.
Since this paper focuses exclusively on the entire formation process of FG and SG stars in GCs, it does not discuss other key issues related to the origin of multiple stellar populations in GCs, such as GC formation from nucleated dwarfs (e.g., Freeman 1993; Bekki & Freeman 2003; Böker 2008), chemical evolution of forming GCs (Bekki et al. 2007; D’Ercole et al. 2010), the importance of lithium production of AGB stars in the origin of multiple stellar populations (e.g., Ventura & D’Antona 2010), the origin of the Galactic GCs with unique characteristics of multiple stellar populations such as NGC 1851 (e.g., Yong et al. 2009), NGC 2419 (e.g., Cohen & Kirby 2012), and NGC 2808 (e.g., Bragaglia 2010), the formation of ω Centauri with age and metallicity spreads (e.g., Lee et al. 1999; Hilker et al. 2004; Bellini et al. 2009; Johnson & Pilachowski 2010; Marino et al. 2012), and the origin of He-rich populations in GCs (e.g., Norris 2004; Lee et al. 2005; Piotto et al. 2005), and GC-halo connections (e.g., Vesperini et al. 2010; Martell et al. 2011). Each of these key issues would need to be discussed in detail in a separate paper.
The plan of this paper is as follows. In the following section, we describe the methods and techniques of our galaxy-sale simulations with a special model for star formation from AGB ejecta. In Sect. 3, we present the numerical results on the formation processes of both FG and SG stars and their dependencies on physical properties of GC host dwarfs. In Sect. 4, we discuss the important implications of the present results in terms of (i) physical mechanisms of dilution of AGB ejecta by pristine gas and (ii) possible internal [Fe/H] spread in stars of individual GCs. We summarize our conclusions in Sect. 5.
The present simulations are different from our previous ones which could combine direct N-body simulations of star clusters based on the NBODY code with hydrodynamical simulations (Hurley & Bekki 2008). Therefore, we cannot discuss the long-term dynamical (>1 Gyr) evolution of forming clusters within dwarfs. We will discuss th important issues in our forthcoming paper. Fast-rotating massive stars (FRMS), AGB stars, massive interacting binaries (MIB), and supermassive stars are suggested to be “polluting” stars, the ejecta of which can be mixed with pristine ISM and consequently converted into new stars (e.g., Karakas et al. 2006; Bastian et al. 2013; Krause et al. 2013; Denissenkov & Hartwick 2014; see Renzini et al. 2015 for a critical review for advantages and disadvantages of each of these polluters in the formation of GCs). We do not discuss which of the four polluters is the most promising one for self-consistently explaining the observed properties of GCs with multiple stellar populations in this paper. There are many observational papers on the internal variations of chemical abundances (e.g., light elements, s-process elements,[Ca/H], and [Fe/H]) in GCs with luminosities and sizes (e.g., Cohen 1981; Cottrell & Da Costa 1981; Smith 1987; Kraft 1994; Norris & Da Costa 1995; Yong et al. 2015). The origin of internal abundance variations ineach of these individual GCs will need to be discussed in our forthcoming papers.
2 The model
2.1 A possible scenario
Figure 1 briefly illustrates a GC formation scenario, of which the details are investigated and discussed in this paper. The entire GC formation process from GC host galaxy formation to GC migration into the Galactic halo is divided into six physical processes (STEPS 1–6) for convenience in Fig. 1. STEP 1 is the formation of massive clumps consisting of gas and new stars in very gas-rich massive dwarf disk galaxies that can be ubiquitous at high z. STEP 2 is the formation of massive FG systems from merging stellar clumps and filaments developed in these clumps. As shown later in this paper, the formation process of FG stellar systems is rather complicated, which influences the formation of SG stars within FG systems. Therefore, the formation of massive clumps is a key physical process of FG system formation, and a better understanding of the physical conditions required for the clump formation will hopefully lead to a comprehensive understanding of why GCs with multiple stellar populations can be formed mostly at high z. The minimum halo mass (Mh, min) required for a dwarf to host a GC is described as follows:
 (1)
(1)
where Fg is the mass ratio of cold gas to stars, SN is the specific frequency of GCs (e.g., Harris & van den Bergh 1981), and Fb is the mass ratio of baryonic components (cold gas and stars) to dark matter (later we use fb for simulations to distinguish between observed and simulated baryonic fractions). Since higher SN and Fb are adopted as reference values above, Mh, min can be significantly higher than the above in real galaxies. For example, Mh, min = 2.3 × 10¹⁰ M⊙ for SN = 2 and Fb = 0.05. Mh, min in the above Eq. (1) is a reasonable guideline to simulate GC formation in dwarfs.
STEP 3 is the formation of SG stars in forming FG systems: gas ejection from AGB stars, accretion of the ejecta onto the FG systems, and conversion of the ejecta. The present study focuses exclusively on the formation of new stars from AGB ejecta, and does not discuss the importance of other polluters (e.g., FRMS and massive binary stars). STEPS 2 and 3 correspond to the “two-stage” formation process of GCs with multiple stellar populations. STEP 4 is the almost complete destruction of FG stellar systems by the tidal field of GC-host dwarfs. Other mechanisms of FG destruction, such as expansion through gas expulsion (e.g., Khalaj & Baumgardt 2016), could also be possible. STEP 5 is the accretion of GC host dwarfs onto the halo region of the Galaxy in the early formation history of the Galaxy. STEP 6 is the destruction of GC host dwarfs by the strong tidal field of the Galaxy. During this tidal destruction, GCs within the dwarfs can be stripped to become one of the Galactic halo GCs. These accretion events of dwarfs with GCs are key physical processes in interpreting the observational data of GC properties in the Galactic halo (e.g., Forbes & Bridges 2010). STEPS 4–6 are not investigated in the present study, and will be discussed in our forthcoming papers based on separate numerical simulations on dynamical evolution of GCs and dwarfs.
Formation of massive gas clumps in relatively gas-rich luminous disk galaxies was already investigated by Shlosman & Noguhi (1993) and the importance of such gas clumps in various galaxy formation processes was also discussed by Noguchi (1999). Bekki (2007) also showed that massive clumps consisting of gas and stars can be formed in gas-rich dwarf galaxies anddiscussed the formation of stellar galactic nuclei through merging of such GC-like clumps. However, these previous simulations did not discuss the roles of massive clumps in the formation of GCs with multiple stellar populations. The present study therefore investigates whether and how massive gaseous and stellar clumps (corresponding to FG stellar systems) can be formed in gas-rich dwarf disk galaxies in detail.
Although GC formation in dwarf galaxies has been modeled in previous theoretical models (e.g., Beasley et al. 2002; Bromm & Clarke 2002; Kravtsov & Gnedin 2005; Bekki et al. 2008), whether “GCs” have multiple stellar populations has not been discussed. Currently, it is well known that almost all old GCs in the Galaxy contain multiple stellar populations (Carretta et al. 2009). Therefore, it is not clear whether or not “GCs” in these previous simulations are genuine GCs. Although recent simulations of cluster formation by Renaud et al. (2015) discussed prolonged star formation within clusters, they did not include AGB ejecta in their simulations. Therefore, their models did not enable the authors to discuss whether the simulated clusters can become GCs with internal abundance spreads in light elements. The present study, for the first time, tries to select “genuine” GCs with at least two stellar populations in the hydrodynamical simulations of dwarf galaxy evolution with secondary star formation from AGB ejecta.
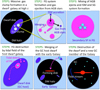 |
Fig. 1 Formation of Galactic GCs with multiple stellar populations in a very gas-rich dwarf at high z. The entire formation process is divided into six steps. STEP 1: formation of massive clumps consisting of gas and new stars in verygas-rich massive dwarf disk galaxies. STEP 2: formation of massive FG systems from merging stellar clumps and filaments developed in these clumps. STEP 3: formation of SG stars from AGB ejecta mixed with pristine ISM in forming FG systems. STEP 4: almost complete destruction of FG stellar systems by the tidal field of GC-host dwarfs. STEP 5: accretion of GC host dwarfs onto the halo region of the Galaxy in the early formation history of the Galaxy. STEP 6: destruction of GC host dwarfs by the strong tidal field of the Galaxy. |
2.2 The required large baryonic fraction for GC formation
In Eq. (1), a reference value of Fb = 0.1 is adopted to discuss a plausible Mh, min: it should be stressed here that Fb is the mass fraction of gas and stars. As described later in this paper (Sect. 3), such a high Fb (> 0.05) is indeed required for GC formation within the simulated dwarf galaxies. However, it should be noted that the required high Fb would be much larger than the average of Fb for Mh ~ 1010 M⊙ in recent theoretical studies of galaxy formation based on ΛCDM models (e.g., Moster et al. 2013). The results of the semi-analytic model of galaxy formation presented by these latter authors accordingly imply that only rare dwarf galaxies with very high Fb can form genuine GCs with FG and SG stars in the present scenario. Moster et al. (2013) also showed that more massive halos can have higher Fb for Mh < 1012 M⊙. Their results suggest that only high-mass halos with Mh > 1011 M⊙ can have the required high Fb for GC formation. These theoretical results imply that the required high Fb in the simulated galaxies of the present study could be a potentially serious problem in the present GC formation scenario. It should be noted, however, that there are a number of observed galaxies with Mh = 1010−1011 M⊙ that have relatively high Fb (e.g., Fig. 16, Papastergis et al. 2012). The Small Magellanic Cloud is also an example galaxy where the baryonic mass fraction is rather large (Bekki & Stanimirovic 2009). Therefore, the present models with high Fb are not completely inconsistent with observations. It may also be possible that high-z dwarfs have higher Fb within their disks than the low-z counterparts.
The possible threshold halo mass for GC formation (described later in Sect. 3) implies that the typical metallicity of GCs can be high. We can discuss this point briefly, using either the observed mass-metallicity relation of dwarfs or the theoretical prediction from semi-analytic models of galaxy formation (e.g., Guo et al. 2016). Gas-rich dwarf galaxies with Mh = 5 × 10⁹ M⊙ and Ms = 108 M⊙ can have a metallicity of [Fe/H] ~−1, according to the mass-metallicity relation (Z ~ M0.46) derived by Tremonti et al. (2004). Accordingly, the present GC formation scenario, in which Mh, min ~ 5 × 10⁹ M⊙, suggests that most GCs can have [Fe/H] ~−1. This is not consistent with the observed metallicity distribution function of the Galactic GCs, which shows a metallicity peak around [Fe/H] = − 1.6 (e.g., Harris 1999). However, the mass-metallicity (or luminosity-metallicity) relation at high z could be quite different from that at z = 0 (e.g., Guo et al. 2016). Furthermore, there is a large scatter in metallicities of galaxies for a given galaxy mass at higher redshifts in theoretical predictions (e.g., Guo et al. 2016). Also, Ms can be significantly lower than 108 M⊙ (thus lower metallicities) in the halos with Mh = 5 × 10⁹ M⊙ at high z. We therefore do not consider that the observed typical metallicity of GCs is not a problem for the present scenario of GC formation: if the GC-host dwarfs have metallicities slightly smaller than the observed ones for their masses (e.g., Tremonti et al. 2004), then the typical metallicity of GC can be reproduced. Furthermore, as described later, the present results do not depend on the adopted [Fe/H].
2.3 GC host dwarfs
In order to perform numerical simulations of GC formation in dwarf disk galaxies on GPU clusters, we have revised our previous code (“GRAPE-SPH”; Bekki 2009), which can be run on the special computer for gravitational dynamics (GRavity PipE; Sugimoto et al. 1990). In the present paper, we describe only the key ingredients of the older version of the code and focus on the new physics that is incorporated into the revised version (e.g., inclusion of star formation from AGB ejecta). Since we mainly investigate dynamical processes of GC formation, we do not include chemical evolution in the present simulations in a fully self-consistent manner.
A dwarf disk galaxy is modeled as a fully self-gravitating system and is assumed to consist of a dark matter halo and stellar and gas disks. The dark matter halo and the main stellar component of the dwarf are represented by collisionless N-body particles, whereas the gas component is represented by SPH particles. The total masses of the dark matter halo, the stellar disk, and the gaseous disk in the dwarf are represented by Mdm, Ms, and Mg, respectively. The baryonic mass fraction (fb = (Ms + Mg)∕Mt, where Mt = Mdm + Ms + Mg) and gas mass fraction (fg = Mg∕(Ms + Mg)) are key parameters that can determine whether GCs with FG and SG stars can be formed in dwarfs.
The density profile of the dark matter halo is represented by that proposed by Salucci & Burkert (2000):
 (2)
(2)
where ρdm,0 and adm are the central dark matter density and the core (scale) radius, respectively. For convenience, we hereafter refer to this profile as the “SB” profile (or model). Recent observational and numerical studies have shown that the adopted “cored dark matter” halos are reasonable for describing dark matter distributions in low-mass galaxies (e.g., Governato et al. 2010; Oh et al. 2011). Therefore, the above SB profile rather than the “NFW” one (Navarro et al. 1996) with a central cusp predicted by the cold dark matter (CDM) model is better for the present model for dwarfs. For the SB profile, the dark matter core parameters, ρdm,0, adm, and M0 (where M0 is the total dark matter masswithin adm), are not free parameters and clear correlations are observed between them (Burkert 1994):
 (3)
(3)
where C0 is 4.3 × 10⁷ in the original formula by Burkert (1994). We mainly present the results of the models with C0 = 2.2 × 10⁷ (i.e., more compact dark matter halo). All dark matter particles are distributed within 5adm.
The stellar component of the dwarf is modeled as a bulge-less stellar disk with the size of Rs. The radial (R) and vertical (Z) density profiles of the stellar disk are assumed to be proportional to exp(−R∕Rs,0) with scale length Rs,0 = 0.2Rs and to sech2(Z∕Zs,0) with scale length Zs,0 = 0.04Rs, respectively. In addition to the rotational velocity caused by the gravitational field of disk and dark halo components, the initial radial and azimuthal velocity dispersions are assigned to the disk component according to the epicyclic theory with a Toomre’s parameter Q. In the present study, the Q parameters for stars (Qs) and gas (Qg) are assumed to vary independent of one another, meaning that we can investigate how the initial stellar and gaseous kinematical properties of dwarfs can influence the formation processes of GCs with multiple stellar populations. The vertical velocity dispersion at a given radius is set to be half as large as the radial velocity dispersion at that point.
The interstellar medium (ISM) of the dwarf is modeled as a thin gaseous disk with the size of Rg = frRs, where fr is a parameter that determines the size ratio of gaseous to stellar disks in a dwarf. We mainly investigate the models with fr = 2 in the present study. The radial and vertical density profiles of the gas disk are assumed to be proportional to exp (−R∕Rg,0) with scale length Rg,0 = 0.5Rg and to sech 2(Z∕Zg,0) with scale length Zg,0 = 0.04Rs, respectively. Each gas particle is allocated an initial temperature (Tg) and the models with Tg = 300 K, 1000 K, and 10 000 K are investigated. The radiative cooling processes are properly included using the cooling curve by Rosen & Bregman (1995) for 100 ≤ T < 104 K and the MAPPING III code for T ≥ 104 K (Sutherland& Dopita 1993). The formation and evolution of dust and molecular (H2) gas that is properly modeled in our recent simulations for the evolution of gas-rich galaxies (e.g., Yozin & Bekki 2014; Cortese 2016) is not modeled in the present study.
We mainly show the results of the models in which all gas particles have initially the same metallicity ([Fe/H]0). We discuss briefly how initial metallicity gradients in gas disks of dwarfs can influence the internal abundance spreads of FG stars of GCs later in Sect. 4. Guided by a mass-metallicity relation (Z ∝M1∕4), the initial metallicity of a dwarf is determined by the total stellar mass (Ms) and the gas mass fraction (fg). For example, the standard model with Md = 5 × 10⁸ M and fg = 0.8 have [Fe/H]0 = −1.45. The values of [Fe/H]0 for Mdm = 2 × 10⁹, 6 × 10⁹, and 6 × 10¹⁰ M⊙ are − 1.83, − 1.66, and − 1.44, respectively. These initially metallicities are much less important, firstly because only radiative cooling depends on [Fe/H] in the present study, and secondly because the physics of clump formation (i.e., GC progenitors) is due to the dynamical instability of gas-rich dwarfs. We indeed confirmed that the results do not depend on metallicities using models with [Fe/H] = − 0.7 and − 2.5 as standard.
The initial total number of particles for dark matter halo, stellar disk, and gaseous disk are 4 × 10⁵, 4 × 10⁵, and 2 × 10⁵ in a dwarf disk galaxy. The total number of particles can increase form this initial number (N = 106) up to N ~ 1.2 × 10⁶ as new stellar particles eject new gaseous particles during their AGB phases. We need to investigate GC formation by using this N ~ 106, because we have to finish running ~80 models for the limited amount of computational time allocated for this study. The gravitational softening length (ϵg) is assumed to be different between different components (e.g., dark matter) and determined from the initial mean particle separation for each component. Therefore ϵg depends both on the size and the mass of a dwarf, and the value is later given for each model.
2.4 Star formation and SN feedback
A gas particle is converted into a new star if the following condition is met:
 (4)
(4)
where ρg and ρth are the local gas density around the gas particle and a threshold density for star formation. The mass of the new stars is exactly the same as that of the original gas particle. Although we investigate the models with ρth = 1, 10, 100, and 1000 atoms cm−3, we show the results of the models with ρth = 100 atoms cm−3, because GCs with compact SG stellar systems can be clearly seen in these models. If ρth is much less than 100 atoms cm−3, then the SG stellar systems in the present simulations become too diffuse to be consistent with the observed GCs. On the other hand, if ρth is as large as 1000 atoms cm−3, then star formation is too strongly suppressed in gas disks leading to underdevelopment of FG stellar systems. We thus need to adopt a reasonable ρth in the present galaxy-scale simulations, because the simulations cannot resolve the real subparsec-scale star formation processes. New stars formed from initial gas disks and from AGB ejecta are referred to as FG and SG stars, respectively, for convenience.
A new star can become a SN and therefore can eject gas and energy a certain time (tsn) after its formation and the surrounding gas particles can receive the mass and energy of the SN. The SN explosion can start ~ 106 yr after new star formation and can continue until ~3 × 10⁷ yr after the star formation. These values are reasonable, given the lifetime of the least and most massive progenitors of SNII (8 M⊙ and 100 M⊙). Thornton et al. (1998) investigated the energy conversion processes of SNe in detail and found that about 8.5 × 1049 ergs among the total energy of a SN (~1051 erg) can be in the form of kinetic energy. Following these results, we consider that (i) the energy of each SN is assumed to be used for the increase in random motion (“kinematic feedback”) in the present study and (ii) the ejected gas with an ejection velocity (Vej) of 920 km s−1 (corresponding to less than 10% of the initial SN energy) can be mixed with the surrounding gas particles soon after SN explosion. We also investigate “stronger feedback models” with Vej = 2916 km s−1 to understand how the present results depend on the modeling of SN feedback effects. We consider only SNII (not SNIa) in the present study, mainly because we investigate only 560 Myr evolution of dwarf galaxies. The canonical Salpeter IMF (the slope of αIMF = 2.35) with the lower and upper cut-off masses being 0.1 M⊙ and 50 M⊙, respectively, is adopted and the number of SNII per unit mass is calculated for the adopted IMF.
2.5 A new model for the evolution of AGB ejecta
The mass of a particle that is used for modeling (i) ejection of gas from AGB stars and (ii) the subsequent star formation from the gas is much smaller than the masses of old stars and dark matter halos. Furthermore, feedback effects of AGB wind (~ 10−20 km s−1) need to be properly modeled within a scale of less than 100 pc. Accordingly, we adopt an original numerical method for gas ejection andfeedback effects of AGB stars in order to investigate this important secondary star formation from AGB ejecta with sufficient mass and scale resolutions. In the present simulations, we try to resolve pc-scale dynamical evolution of AGB ejecta within newly formed FG stellar systems by (i) ejecting “AGB” gas particles with masses much smaller than the initial gas particle masses within local FG systems and (ii) adopting very short time-step width and significantly smaller gravitational softening length for the AGB gas particles. This “AGB gas ejection method” has a number of advantages in simulating GC formation from massive gas clumps, which are described later in this paper. The details of the method are given as follows.
2.5.1 Ejection of new particles
Each new star is assumed to eject nagb new gaseous (SPH) particles when it enters into its AGB phase, and these gaseous particles correspond to AGB ejecta and are referred to as “AGB particles” for convenience. The mass of AGB ejecta (magb) is much smaller than the original gas particle mass, and many particles (~ 1000) from many new stars can be generated in a forming FG stellar system. Therefore, the mass-resolution in the FG system can be much better than that for the host dwarf galaxy. The value of magb is determined according to the adopted IMF and the mass range of AGB stars. For example, magb ~ 0.05mg for a standard IMF, where mg is the mass of an original gas particle. Thus, the mass resolution of a forming GC in the present study can be as good as 102 −103 M⊙: the resolution depends on the initial total mass of the dwarf and the initial particle number of gas.
Although it is ideal for the present simulations to model continuous ejection of gas during AGB phases (over many time steps) for different AGB stars with different masses, it is extremely numerically costly and indeed impractical to simulate such continuous AGB gas ejection because of a huge number of particles required for such simulations. Therefore, we assume that each new star can eject one new particle (nagb = 1) with a mass magb only one at a time (tagb) when it becomes an AGB star. These AGB particles are assumed to interact gravitationally and hydrodynamically with neighboring particles. By using the nucleosynthesis yields of AGB stars from van den Hoek & Groenewegen (1997; VG97), we calculate magb for the adopted Salpeter IMF in each model. Since we consider that AGB stars with their initial masses ranging from 5 M⊙ to 8 M⊙ can eject gas that can be used for the formation of SG stars, we assume that the lifetime of a star with m = 8 M⊙ can correspond to tagb. We do not model the continuous ejection of gas from AGB stars with different masses (i.e., do not allocate different tagb for different particles) owing to the above-mentioned numerical cost (i.e., a huge number of particles necessary to model this).
This adopted AGB gas ejection method has the following additional advantages in simulating GC formation within dwarfs. AGB gas particles can interact with other new AGB gas particles within FG stellar systems so that star formation from pure AGB ejecta and gas dynamics of AGB ejecta within the FG systems can be self-consistently investigated. In standard galaxy-scale chemodynamical simulations, all AGB ejecta are assumed to mix with interstellar medium without generating new AGB particles. Therefore, star formation from pure AGB ejecta cannot be properly modeled. Thus, if there is no AGB gas particle in numerical simulations, then we cannot investigate crucial physical processes of GC formation (i.e., star formation from pure AGB ejecta) using the simulations.
2.5.2 AGB feedback effects
New particles are ejected from AGB stars with ejection velocities (vej, agb) and gaseous temperatures (Tg, agb), meaning they can influence local dynamics of gas around AGB stars. As shown by previous numerical simulations (D08; B11), AGB ejecta with vej, agb ~ 10 km s−1 cannot be kept in less massive FG stellar systems. It is thus possible that AGB ejecta can also significantlyinfluence the formation processes of SG stars in the present simulations. We investigate this “AGB feedback effect” on the formation and evolution of FG and SG stellar systems mainly for vej, agb = 20 km s−1 and Tg, agb = 1000 K. We also investigate the model without AGB feedback effects (vej, agb = 0 km s−1) in order to understand more clearly whether stellar winds of AGB stars can suppress star formation at GC formation.
2.5.3 Much smaller individual time step width
We consider that the maximum time step width (δtmax) should be different between AGB particles and other particles in a simulation. For dark matter particles, stellar particles, and gaseous particles (other than AGB ejecta), δtmax is set to be 1.4 × 10⁶ yr and the time step width at each time step is determined for each particle according to the physical conditions of the particle (e.g., Courant condition) for all models in the present study. This δtmax is not short enough to properly investigate the formation of SG stars from AGB ejecta in the FG stellar systems, because the local dynamical time scale of the FG systems is significantly shorter than ~ 106 yr. We therefore consider that AGB ejecta particles can have δtmax (δtmax, agb) significantly shorter than 1.4 × 10⁶ yr. We mainly show the results with δtmax, agb = 8.8 × 10⁴ yr, because the models with δtmax, agb ≤ 8.8 × 10⁴ yr show rather similar results on the formation of SG stellar systems.
It is confirmed that if δtmax, agb = 1.4 × 10⁶ yr (corresponding to the time step width for original gas and star particles), then compact SG stellar systems cannot be formed. This demonstrates that a much smaller individual time step width is required for simulating the formation of SG stars from AGB ejecta. The adopted time-stepping method for AGB ejecta within forming star clusters is quite different from those adopted in previous galaxy-scale simulations including ours (e.g., Bekki 2013). It should be stressed here that this kind of time-stepping method is necessary to discuss the evolution of ejecta from dying stars and SNe within existing star clusters. Owing to the much smaller time step width (and many AGB particles within a forming FG system), radiative cooling based on the cooling curve by Rosen & Bregman (1995) for T < 104 K can be properly included for the SG stars within the FG system. Thus, this adopted very small time-step width for AGB particles enables the present simulations to properly investigate (i) whether AGB ejecta can escape from forming GCs and (ii) whether AGB ejecta can be converted into new stars in galaxy-scale simulations for the first time.
2.5.4 Gravitational softening length
We have to adopt both short δtmax and small ϵg for AGB ejecta particles to properly investigate the formation of SG stellar systems in forming GCs, because the SG systems should be rather compact (~ 10 pc). We therefore consider that ϵg for new stars formed from gas (either from initial disk gas or from AGB ejecta) should be significantly smaller than that for old stars. We assume that ϵg for new stars (ϵg, ns) is 10% of ϵg for old stars (ϵg,os). The value of ϵg, ns is typically ~ 2 pc for dwarfs with Ms ~ 109 M⊙. Thanks to this small ϵg,ns combined with short δtmax, agb, we can better investigate the formation processes of GCs with FG and SG stars in the present study.
The gravitational softening lengths for massive dark matter (ϵg, dm), old disk stars (ϵg,os), ISM (ϵg, g = ϵg, os), new stars (ϵg,ns), and AGB ejecta (ϵg,agb = ϵg, ns) are quite different in the present study. When two different components interact gravitationally, the mean softening length for the two components is applied for the gravitational calculation. For example, ϵg for the gravitational interaction between old stars and SG stars (and AGB ejecta) is as follows:
 (5)
(5)
Although the softening length of dark matter particles is relatively large (and therefore the spatial resolution is poorer), the adopted multiple softening lengths (much smaller softening length for SG stars from AGB ejecta) can avoid unrealistic dynamical heating of SG stars by old stars and dark matter halos in dwarfs, and guarantee that linear and angular momentum can be conserved for a simulation with different softening lengths.
2.5.5 Star formation of second-generation stars
We consider that the threshold SF density can be different between SF in gas clouds (i.e., in “normal” situations) and in dense stellar systems (i.e., in FG stellar systems), because high-velocity interaction between stars and forming molecular gas clouds in FG stellar systems could prevent the gas clouds from collapsing gravitationally. Therefore, ρth for SG formation (ρth, SG for convenience) can be different from ρth for FG star formation. We mainly investigate the models in which ρth,SG = ρth in the present study and discuss briefly how ρth, SG can influence the formation of compact SG stellar systems in forming GCs. The new stars formed from AGB ejecta (i.e., SG stars) are assumed to eject no gas during their AGB phase, meaning the total number of particles cannot dramatically increase owing to the formation of third/fourth generations of stars. This assumption is reasonable, because the total mass of new stars formed from SG AGB stars is much smaller than the total mass of FG and SG stars.
2.6 Identification of globular cluster candidates
It is an important task for this study to precisely identify GC candidates with both FG and SG stars for each model. The method to identify GC candidates is as follows. First, we investigate the total masses of FG stars (MFG), ISM (MISM), AGB ejecta (MAGB), and SG stars (MSG) within rGC from the location of each new stellar particle at the final time step (T = 0.56 Gyr) in each model. The total mass of a GC for GC identification is therefore denoted as
 (6)
(6)
If MGC exceeds a threshold mass (Mth, GC) beyond which GCs with the present typical mass of 2 × 10⁵ M⊙ are considered to be able to form, then the new stellar particle is regarded as being in a massive GC-like system (or clump). In this way, we try to identify all massive GC-like systems in each model. We adopt Mth, GC = 2 × 10⁶ M⊙ and rgc = 57 pc as reasonable values to clearly identify originally massive GC-like systems. Since some GC-like systems with MGC ≥ Mth, GC can be dominated by ISM and AGB ejecta, we have to select real GC candidates from the selected massive systems.
Subsequently, we investigate MSG in each of the selected massive GC-like systems, and regard the system as a GC candidate if MSG ≥ 2 × 10⁵ M⊙. The stellar systems with MSG < 2 × 10⁵ M⊙ are likely to become low-mass clusters without significant SG populations after most of the FG stars are lost after SG formation. These systems are found to have very diffuse FG stellar systems for most cases, and some of them have a larger amount of gas (i.e., identified as compact systems owing to high gas densities). Although the majority of GC candidates identified as above can have compact SG stellar systems, some of them can have diffuse ones, which can only be confirmed by investigating morphological properties and radial density profiles (i.e., not automatically). These GC candidates might not be regarded as “genuine GC”, but the properties of these GCs are used for some statistical discussion on GC properties.
Description of the basic parameter values for the standard model M1.
2.7 Parameter study
We mainly describe the results of the “standard model” with Mdm = 2 × 10¹⁰ M⊙ within 5adm (i.e., fb = 0.11), Ms = 5 × 10⁸ M⊙, Mg = 2 × 10⁹ M⊙ (i.e., fg = 0.8), adm = 2.8 kpc, Rs = 2.3 kpc, Rg = 4.6 kpc, Qs = 1.5, Qg = 0.5, Tg = 300 K, ρth = ρth, SG = 100 atoms cm−3, [Fe/H]0 = −1.45, ϵg,dm = 193 pc, ϵg,os = 21 pc, and ϵg,ns = 2 pc, because thismodel more clearly shows essential ingredients of the sequential formation processes of FG and SG stars in forming GCs. A summary of these model parameters is given in Table 1. It should be noted here that fb is high in each model because dark matter halo is truncated at r = 5adm. If the halo is extended to the virial radius, then fb should be significantly higher than the adopted value. Although we have investigated many models (~ 100) in order to find models in which genuine GCs with both FG and SG stars are formed, we describe the results only for key representative models in the present study. The parameter values for these 29 models are summarized in Table 2.
Dwarf galaxies are observed to have higher gas fractions in the local universe. For example, the following correlation between gas (neutral hydrogen) mass (Mg) and stellar mass (M*) in galaxies with different masses and types at low redshifts is derived by Papastergis et al. (2012):
 (7)
(7)
Using this relation, a reasonable gas mass fraction for the dwarf with Ms = 5 × 10⁸ M⊙ adopted in the standard model is estimated to be 1.02 (fg ~ 0.5). The adopted fg of 0.8 in the standard model is significantly higher than the above value, though the observed relation shows a large scatter for a given stellar mass. Given that high-z galaxies are observed to have higher gas fractions (e.g., Narayanan et al. 2012 for detailed discussion), the adopted gas fraction should be reasonable for high-z dwarf galaxies.
Figure 2 shows the initial rotation curve profile of the dwarf disk galaxy and the gas distribution projected onto the x–y plane at T = 56 Myr in the standard model. The model shows a slowly rising rotation curve until R = 3 kpc owing to the adopted cored dark matter halo, and the lower dark matter density in the inner region means a higher degree of self-gravitation in the baryonic components, which can possibly play a vital role in the evolution of the gas disk. The shapes of rotation curves do not evolve significantly within 0.56 Gyr owing to a lack of merging and gas infall. The dwarf disk is initially so gas-rich (fg = 0.8) that many filamentary or clumpy structures can develope as a result of local gravitational instability. Formation of FG and SG stellar systems from these gaseous structures is the most important issue in the present numerical simulations.
In the present study, Mdm, fg, and fb are considered to be the key parameters that mainly determine whether GCs with compact SG stellar systems can be formed. We therefore describe the results of the models with 2 × 10⁹ ≤ Mdm∕M⊙≤ 6 × 10¹⁰, 0.02≤ fb ≤ 0.11, and 0.2 ≤ fg ≤ 0.95. We also show the results of the “LSB” (low surface-brightness) models in which the initial mean surface mass densities of the stellar disks are 2.52 times lower in comparison with the standard model that is regarded as a HSB galaxy. The “higher surface density model” has a stellar disk two times smaller than that of the standard model.
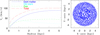 |
Fig. 2 Initial contributions of dark matter, old stars, and gas to the rotation curve of a gas-rich dwarf at T = 0 Myr and the gas distribution projected onto the x–y plane at T =56 Myr in the standard model (M1). |
2.8 Limitations of the model
Gas particles ejected from AGB stars can be converted into new stars without mixing with pristine ISM around forming GCs in the present simulations. Although this method to convert AGB ejecta into new stars allows us to investigate how SG stars can be formed fromAGB ejecta, we are unable to discuss how the mixing of AGB ejecta and ISM can determine the chemical abundances of SG stars. Also, ISM that is later accreted onto the inner regions of forming FG stellar systems can be identified as “FG” stars in the present model, though such ISM can be mixed with AGB ejecta and then converted into SG stars. This is one of the major limitations of the present study, and accordingly we need to consider this in interpreting the simulation results.
AGB stars with different masses can eject different amounts of gas with different chemical compositions, which can determine the nature of (anti)correlations between different chemical abundances within GCs. This means that a large number of gas particles would need to be used for just one stellar particle consisting of stars with different masses for long-term chemical enrichment of intra-cluster medium by AGB stars. In the present study, we investigate the models with nAGB = 1 in order to avoid the expected huger number of gas particles. This is one reason why the present simulations do not allow us to discuss the details of chemical abundances of SG stars. We will need to more properly incorporate the AGB ejecta with different chemical compositions in our future simulations.
Furthermore, the resolution of each simulation is only 2 pc at most and gravitational softening lengths are applied. This means that we cannot discuss the long-term evolution of compact stellar systems through two-body dynamical relaxation processes, which can be properly investigated by the NBODY 6 code (e.g., Hurley & Shara 2012). Therefore, the simulated GCs with number densities of 104−105 stars pc−3 at most (in particular FG stellar systems) look more diffuse than the real GC. In order to obtain a fully self-consistent model of GC formation from their birth to destruction, we need to develop a code with which we can investigate both galaxy-scale hydrodynamics of cold gas and dynamical evolution of forming clusters. Clearly, this is beyond the scope of this paper.
Summary of model parameters.
3 Results
3.1 Standard model
Figure 3 shows the time evolution of the spatial distribution of new stars in the standard model. Clearly, the dwarf disk galaxy can develop several massive high-density stellar clumps, where FG stellar systems (GC progenitors) can form. In the standard model, seven GC candidates (GC1 − 7) with MGC ≥ 2 × 10⁶ M⊙ are identified in the stellar disk of an initially gas-rich dwarf at the final time step (T = 560 Myr). Among these, GC1, GC2, GC4, and GC6 can be regarded as genuine GCs, because they have MSG ≥ 2 × 10⁵ M⊙ and a compact SG stellar system. Accordingly, the 3D locations for only these four genuine GCs are shown in this figure. The same large stellar system can be identified twice as a GC candidate, and the center of mass can be very similar between two GC candidates. GC2 and GC3 have very similar center of mass positions, therefore GC3 was removed from the list of genuine GCs in this model (to avoid double GC counts). None of these GCs with FG and SG stars contain dark matter particles within them (R < rgc = 57 pc).
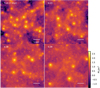 |
Fig. 3 Time evolution of stellar distributions projected onto the x–y (left panel) plane in the standard model. Clearly, several massive high-density clumps of FG stars, where SG stars are forming, can be formed within 0.3 Gyr. |
3.1.1 Two-stage GC formation
Figure 4 shows essential ingredients of GC formation processes in a gas-rich dwarf galaxy for GC1 with MFG = 4.7 × 10⁶ M⊙ and MSG = 9.6 × 10⁵ M⊙ at T = 394 Myr in the standard model. The ISM from which GC1 can form comes originally from different regions widely spread in the initial gas-rich disk meaning that GC1 can finally become quite massive. During the dynamical evolution of the gas-rich disk in the dwarf, new stars can form from the high-density regions of 100 pc-scale filamentary structures that are developed through local gravitational instability (owing to lower Qg). These stars can become two massive stellar clusters in the filaments and field stars (T = 56 Myr). The two clusters correspond to the progenitor of the FG stellar system for GC1. When the two clusters are about to merge (T = 113 Myr), some of the FG stars enter into their AGB phases and consequently start to eject gas. In the late phase of cluster merging (T = 169 Myr), the AGB ejecta can be trapped by the cluster potential and start being converted into new stars (i.e., SG stars).
After the formation of the FG stellar system by merging of clusters, ISM and AGB ejecta can continue to be accumulated in the central region of the diffuse FG stellar system and converted into new stars with a high SF efficiency (T = 226 Myr). It should be noted that these gases are located in filamentary or tail-like structures before their accretion onto the FG stellar system. A compact and elongated SG stellar system can be developed (T = 282 Myr), and the accretion process of AGB ejecta and ISM can continue after the formation of this nested stellar system. The infant GC with FG and SG stars can finally have a rounder shape (T = 394 Myr) owing to dynamical relaxation processes. For this massive GC, ISM that is not pushed out by SNII can be later accreted onto the diffuse FG stellar system to be mixed with AGB ejecta and converted into new stars. This implies that accretion of ISM onto already existing FG stellar systems is a key process for dilution of AGB ejecta in the formation of SG stars.
Figure 5 shows that the major formation epoch of FG stars is ~ 150 Myr earlier than that of SG stars in this model. However, the formation of FG stars can continue even after the major epoch of SG stars (T ~ 230 Myr) for this massive GC. Some of these FG stars forming later than T = 230 Myr cannot be regarded as genuine FG stars, because they form after mixing of interstellar gas with AGB ejecta. Although the total mass of SG stars within the central 20 pc of GC1 is smaller than that of FG stars in the early GC evolution, it can finally become significantly larger than that of FG stars at T ~ 300 Myr. This result means that a nested GC structure can grow on a timescale of ~ 200 Myr. The total mass of FG stars within 50 pc is larger than that of SG stars by a factor of approximately two, which means that most FG stars need to be lost for this GC1 to become similar to the present GCs dominated by SG stars.
AGB ejecta and SG stars of GC1 at T = 394 Myr do not necessarily originate from FG AGB stars of GC1 in this model: About 39% of AGB ejecta in GC1 are from AGB stars that are not within GC1. This means that although some AGB stars formed from ISM in the dwarf disk eject gas that can finally contribute to the formation of SG stars in GC1, they cannot finally become member stars of GC1. Recent theoretical models of GC formation with multiple stellar populations (e.g., D08; B11) have adopted an assumption that all SG stars are formed from AGB ejecta of FG stars. The present result therefore suggests that (i) such an assumption in these recent models is over-simplified and less realistic and (ii) gas from field AGB stars can also be important for the formation of SG stars.
The GC formation processes described above are essentially similar to those investigated in previous studies (e.g., D08; B11) in that most SG stars can form from AGB ejecta in diffuse FG stellar systems that form about 100–200 Myr before the major epoch of SG formation. It is confirmed that this two-stage GC formation is not only for GC1 but also for most of the simulated GCs in the present study. FG stars are initially in filamentary or clumpy structures including sub-clusters, and merging of the clusters is essential for the formation of FG stellar system. Although the majority of SG stars can form after cluster merging for GC1 in the standard model and most of other models, SG formation can occur in two different clusters before the clusters merge with each other in some models. Below, we discuss this later merging of GCs with SG stars in the context of binary GC formation.
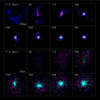 |
Fig. 4 Time evolution of mass distributions projected onto the x–y plane for ISM (blue), FG stars (magenta), AGB ejecta (green), and SG stars (cyan) of GC1 in the standard model (M1). The upper and lower eight panels are for larger and smaller scales of view, respectively. The time T in the upper left corner of each panel shows the time (in units of Myr) that has elapsed since the simulation stars. The thick bar indicates 100 pc and 10 pc for upper and lower eight panels, respectively. The mass-center of GC1 is the center of each frame in this figure. |
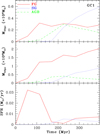 |
Fig. 5 Time evolution of total mass within 20 pc (top panel) and 50pc (middle panel) for FG (red solid), SG (blue dotted), and AGB (green dashed) stars for GC1 in the standard model. Bottom panel: mean SF rate at selected time steps for FG (red solid) and SG (blue dotted) |
3.1.2 Kinematics and structures of GC candidates
Figure 6 shows the final mass distributions of FG and SG stars and line-of-sight rotation curve profiles (Vlos) for GC1. The SG stellar system appears to be flattened and has a larger amplitude of rotation (~ 10 km s−1) than the FGsystem. The Vlos profile for FG stars appears to change more violently at some radii (e.g., at 10 pc in the x-axis), because the FG system contains new stars that are captured later by GC1 and therefore have stream motions within the GC (i.e., not necessarily bound by GC1). The estimated V∕σ, where V and σ are the maximum Vlos and velocitydispersion, respectively, is 0.34 for FG stars and 0.70 for SG stars for GC1. This larger V∕σ in SG stars can be seen in other GCs in the standard and other models. This result is consistent with our previous works (Bekki 2009; B11), which have already shown that SG stellar systems are more strongly dynamically supported by rotation at their formation. It should be stressed that the FG systems of GC1 and other massive GCs can have rotational kinematics owing to merging of sub-clusters at the early formation phases of the systems in the present study. This result implies thatthe origin of rotation observed in some Galactic GCs (e.g., Meylan & Mayor 1986; Anderson & King 2003; Pancino et al. 2007) can be closely related to early formation processes of FG stellar systems through cluster merging.
Figure 7 shows that the projected radial density profiles are steeper in SG stars than in FG stars for GC1, GC2, and GC4. The simulated structures of FG stars in the present study is much less compact than those modeled in previous studies (e.g., D08; B11), which implies that the initial conditions for FG stellar systems in these previous studies may not be realistic. The central density at R ~ 1 pc can be larger than 103 M⊙ pc−2 but less than 104 M⊙ pc−2 in SG stars for these three GCs. The inner density profiles of SG stars have flat cores in the three. These central structures are due largely to the adopted gravitational softening length (ϵg ~ 2 pc) for SG stars. The softening length is too large for this study to properly investigate the dynamical structures for the inner regions (R < 1 pc) of the simulated GCs. The present code does not allow us to investigate the long-term dynamical evolution of GCs driven by two-body relaxation processes within GCs owing to the introduction of a gravitational softening length. Future numerical simulations using a proper code (e.g., NBODY6) will help us to better understand the final structures of GCs with FG and SG stars after their long-term (1− 10 Gyr) dynamical evolution.
The simulated nested structures of GCs with different radial profiles between FG and SG stars imply that GC stars with different ages can have different radial density profiles. It is, however, observationally difficult to separately investigate the radial density profiles of stellar populations with different ages in old GCs. Recently, Li et al. (2016) discovered two stellar populations with different ages of a few hundred million years in three intermediate-age GCs within the LMC and thus confirmed that there was secondary star formation possibly from accreted gas onto the GCs. The above simulation results suggest that if the radial profiles of the two populations in each of these GCs and other LMC GCs with age spreads among the stars (e.g., Girardi et al. 2011; Goudfrooij et al. 2014; Milone et al. 2015) can be derived and then compared with the corresponding simulations, then the origin of these GCs will be better understood.
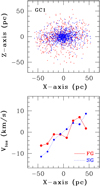 |
Fig. 6 Distributions of FG (red) and SG (blue) stars projected onto the x–z plane (upper panel) and the line-of-sight velocity profile (Vlos) for FG (solid) and SG (dotted) stars (lower panel) for GC1 in the standard model. |
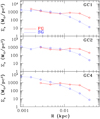 |
Fig. 7 Projected radial density profiles (Σs) of FG (red solid) and SG (blue dotted) stars for GC1 (top panel), GC2 (middle panel), and GC4 (bottom panel) in the standard model. |
3.2 Parameter dependencies
3.2.1 SN and AGB feedback effects
The following two points are clearly seen in Fig. 8. First, SN feedback effects are quite important in controlling both the number of GC candidates and the total mass of SG stars in each GC. The number of GCs is lower in the model M2 with strong SN feedback effects and higher in the model M3 without SN feedback effects in comparison with the standard model. Only two GCs can be formed in the model with strong SN feedback effects, and one of the two has an MSG that is too small to be identified as a genuine GC. The mass fraction of SG stars (fSG) is systematically higher in GCs formed in the model M3 without SN feedback effects. These results imply that careful modeling for SN feedback effects would be required for better understanding the formation efficiency of GCs in dwarfs. Second, AGB feedback effects can also influence the formation efficiency of genuine GCs with MSG ≥ 2 × 10⁵ M⊙. The number of GC candidates with MFG ≥ 106 M⊙ (8) in the model M4 with no AGB feedback effects is larger than that (6) in the standard model, which implies that thermal and kinetic energy from AGB stars can prevent efficient conversion of AGB ejecta into SG stars in FG stellar systems.
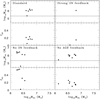 |
Fig. 8 Dependencies of MSG and fSG on MFG for GC candidates in four models: the standard model M1 (upper left panel), M2 with strong SG feedback effects (upper right panel), M3 with no SN feedback effects (lower left panel), and M4 with no AGB feedback effects (lower right panel). |
3.2.2 Gas mass fraction
Figure 9 shows how the formation efficiency of genuine GCs with MSG ≥ 2 × 10⁵ M⊙ depends on gas mass fractions (fg) of gas-rich dwarfs. A larger number of GC-like systems with MGC ≥ 2 × 10⁶ M⊙ can be formed inthe model M5 with fg = 0.67 and fb = 0.07 and all of them have smaller MSG and diffuse structures in the SG stellar systems. A few of them have MSG ~ 2 × 10⁵ M⊙, which can be identified as low-mass GCs, however, none of the simulated clusters have MSG > 2 × 10⁵ M⊙. The model with fb = 0.05 does not show any GC-like objects with MSG ~ 2 × 10⁵ M⊙ (e.g., M11). The results of M5 and M11 therefore suggest that if fb ≤ 0.05, then star clusters formed within dwarf galaxies are unlikely to evolve into the present GCs dominated by SG stars.
The model M6 with fg and fb higher than those in the model M5 shows two genuine GCs with MS ≥ 2 × 10⁵ M⊙, the number of which is, however, significantly smaller than that derived in the standard model. These two results imply that a significantly high fg is required for the formation of genuine GCs for lower fb.
The model M7 with a lower fg (=0.4) yet a larger fb shows three genuine GCs, though fSG is not particularly high for the three. This result suggests that the degree of self-gravitation in the baryonic component of a dwarf galaxy is a key parameter for the dwarf to host genuine GCs for a given gas-mass fraction. The model M8 with a low fg (0.2) and a higher fb (0.11) shows four GC-like systems, none of which can be regarded as genuine GCs owing to their lower MSG and the diffuse structures of their SG stellar systems. The combination of fg and fb can change the total gas mass for a given total dwarf mass (and a given initial mass density of the dwarf). Therefore, these results imply that there is a threshold total gas mass (for a given dwarf mass) beyond which the formation of genuine GCs is possible. Dwarfs are likely to form GCs in their gas disks only when they have a significant amount of cold gas (i.e., only in the early formation phases).
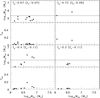 |
Fig. 9 As in Fig. 8 but for GC candidates in four models with different fg (and fb): M5 (upper left panel), M6 (upper right panel), M7 (lower left panel), and M8 (lower right panel). Other model parameters for these four models are the same as those in the standard model. |
3.2.3 Gas surface density
Figure 10 shows the results of the models M9, M10, M11, and M12 with the same initial mean stellar surface densities (Ms = 108 M⊙ and Rs = 2.3 kpc) yet different gas surface densities (Σg). Clearly, genuine GCs with MSG ≥ 2 × 10⁵ M⊙ can be formed in the models M11 and M12 with higher Σg (≥ 15.6 M⊙ pc−2). The mass fraction of SG stars (fg) is larger for the models with larger Σg. In the model M10, with lower Σg, only FG stellar systems with low MSG can be formed, meaning that long-term dynamical evolution is unlikely to lead to genuine GCs. These results mean that Σg is one of the key parameters that can determine the formation processes of GCs.
The results in Fig. 10 demonstrate the presence of diffuse GCs with a smaller fraction (< 0.2) of SG stars in dwarfs. However, the observed fraction of SG stars in GCs with multiple stellar populations is almost always high (~ 0.7; Carretta et al. 2010a). This inconsistency implies that such diffuse GCs need to be destroyed either by their host dwarfs or by the tidal field of the Galaxy after their accretion onto the Galactic halo. Our future simulations need to confirm this selective destruction of GCs with smaller fractions of SG stars. If this is not confirmed, the present model for GC formation has some serious problems.
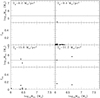 |
Fig. 10 Asin Fig. 8 but for GC candidates in four models with different Σg (i.e., initial mean gas surface density): M9 (upper left panel), M10 (upper right panel), M11 (lower left panel), and M12 (lower right panel). The initial stellar mass is the same (108 M⊙) between the four models, whereas the initial gas mass is different for different Σg. Other model parameters for these four models are the same as those in the standard model. |
3.2.4 Halo mass
The following three points are clearly seen in Fig. 11. First, there can be a threshold dark halo mass (Mdm) beyond which the formation of genuine GCsis possible for given fg and fb. In these four models with fg = 0.8, fb = 0.11, and Rg ∕Rs = 2, only models M1 and M18 with Mdm ≥ 2 × 10¹⁰ M⊙ can host genuine GCs. In the low-mass model M16 with Mdm = 2 × 10⁹ M⊙, massive FG systems cannot be formed from a merger of stellar filaments, meaning AGB ejecta cannot be efficiently converted into new stars (i.e., SG stars). These results explain why faint dwarfs in the Local Group do not have any GCs (e.g., van den Bergh 2010).
Second, the number of genuine GCs is larger for the models with larger Mdm. It should be noted, however, that the GC formation efficiency (ϵgc = Ngc∕Mdm, where Ngc is the total number of GC candidates) is lower in the model with larger Mdm: ϵgc = 3GC per 1010 M⊙ for Mdm = 2 × 10¹⁰ M⊙ and ϵGC = 1.3GC per 1010 M⊙ for Mdm = 6 × 10¹⁰ M⊙. Third, more massive dwarfs with larger Mdm can host GCs. It is intriguing that the most massive SG stellar systems in the model M18 with Mdm = 6 × 10¹⁰ M⊙ is more massive than that in the model M1 with Mdm = 2 × 10¹⁰ M⊙. Some genuine GCs in the model with Mdm = 6 × 10¹⁰ M⊙ have larger fSG (~ 0.4) and larger MSG (~ 3 × 10⁶ M⊙), which could be progenitors of giant GCs in the Galaxy and M31 such as ω Cen and G1.
These results mean that (i) more massive GCs are likely to be formed in more massive GC-host dwarfs and thus (ii) more massive GCs can be more metal-rich because of the mass-metallicity relation of their host dwarfs (i.e., more metal-rich in more massive dwarfs). Conclusion (ii) implies that the origin of the mass-metallicity relation (known as “blue-tilt”) of GCs observed in galaxies (e.g., Strader et al. 2006; Harris et al. 2006) can be related not to chemical evolution within forming GCs but to a trend of more massive GCs to be formed in more massive dwarfs with more metal-rich gas.
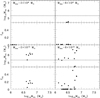 |
Fig. 11 Asin Fig. 8 but for GC candidates in four models with different Mdm: M16 (upper left panel), M17 (upper right panel), M1 (lower left panel), and M18 (lower right panel). fg and fb are the same between these four models. |
3.2.5 Low surface brightness versus high surface brightness
Initial mean stellar surface densities (Σs) can also control the formation processes of GCs. Figure 12 shows the results of two LSB (M13 and M14) and two HSB models (M1 and M15) for fixed Mdm, fg, fb, and Rg ∕Rs. Although numerous massive clumps with masses larger than 106 M⊙ can be formed in the LSB model M13, they are dominated by gas and have diffuse stellar distributions meaning that they cannot become genuine GCs. In the LSB model M14, only a fraction of GC candidates have MSG ≥ 2 × 10⁵ M⊙ and their SG systems are far less compact in comparison to those in the standard model. A larger number of genuine GCs can be formed in the model M15, some of which are very massive (MGC ~ 107 M⊙), like ultra-compact dwarfs. These results clearly demonstrate that mean stellar surface densities of dwarf galaxies are important for GC formation and that dwarfs that are formed at higher redshifts and thus likely to have higher stellar surface densities can host genuine GCs.
It should be stressed that although the model M17 with Mdm = 6 × 10⁹ M⊙ and Rg = 2.5 kpc does not show the formation of genuine GCs, the high-density model M20 with Mdm = 6 × 10⁹ M⊙ and Rg = 1.2 kpc (i.e., rather high-density dwarf) shows GC formation. However, the low-mass yet high-density model M19 with Mdm = 2 × 10⁹ M⊙ and smaller Rg (=0.7 kpc) does not show GC formation. These results combined with those in Fig. 12 imply that the threshold halo mass for the formation of genuine GCs with SG stars is around Mdm = 6 × 10⁹ M⊙. In these low-mass models, SN feedback effects and more compact dark matter distributions can cooperate to suppress the formation of FG and SG stars more severely.
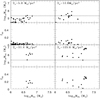 |
Fig. 12 Asin Fig. 8 but for GC candidates in four models with different Σs (initial mean stellar surface density): M13 (upper left panel), M14 (upper right panel), M1 (lower left panel), and M15 (lower right panel). fg and fb are the same between these four models. |
3.2.6 Other minor parameters
Initial gas temperatures (Tg) and Q parameters (Qs and Qg) can be different in GC host dwarfs. The models with different Tg (M23 and M24) and different Q (M25, M26, and M27) are therefore investigated so that the dependencies of the two-stage GC formation processes on these parameters can be understood clearly. The following interesting results are found. Although GC formation processes are not different between M1 and M23 with Tg = 103 K, GCs cannot be formed in M25 with relatively high Tg (= 104 K). This result implies that if the ISM of a dwarf is heated by some thermal processes (e.g., energetic stellar winds from massive stars and reionization effects) prior to GC formation, then GC formation can be severely suppressed. The formation of GCs with SG stars can be clearly seen in M25 with low Qg and M26 with moderately high Qs and Qg (=1.5). However, M27 with high Qs and Qg (=3.0) does not show any GCs with compact SG stellar systems. These results imply that GC formation is possible only when GC host galaxies are kinematically cold systems.
It is confirmed that the models with lower ρth, SG do not show GCs with compact SG stellar systems. For example, the model M28 with ρth, SG = 1 atom cm−3 shows GC candidates, but the SG stellar systems of the candidates are so diffuse that they cannot be regarded as genuine GCs. The diffuse SG system reflects the fact that AGB ejecta can be converted into new stars before a strong gaseous condensation can form in the central region of the FG stellar system through gaseous dissipation. On the other hand, in the model M29 with overly high ρth, SG (1000 atom cm−3), the formation of SG stars is severely suppressed, meaning that the final SG system cannot become particularly compact. These results for M28 and M29 imply that physical conditions required for star formation in dense stellar systems are important for understanding the origin of SG stars in GCs. As discussed in Sect. 2, there could be great uncertainty in the mass-metallicity relation of high-z dwarf galaxies. We accordingly investigated two models in which [Fe/H] = − 0.7 and − 2.5 are adopted yet other parameters are the same as those of the standard one. We have confirmed that the results do not depend on metallicities: the degree of clumpiness in dwarf disks is slightly different between these models. The major two-stage GC formation process is not greatly influenced by the initial metallicities of gas disks of dwarfs.
3.3 Binary globular cluster formation
The morphological properties of the simulated GCs in the present study are diverse depending on the formation processes and their hosts’ physical properties. One of the more intriguing results on GC morphologies is that some GCs have smaller companion GCs with SG stars. Figure 13 shows three examples of binary GCs (M15-GC4, M2-GC1, and M6-GC2) in which smaller companion GCs can merge with larger ones only after the formation of compact SG stellar systems. The smaller companion GCs in these three are later captured by larger GCs and finally merge with them to form single GCs. These GCs are rarely identified at the final step in each simulation, because the timescale of GC merging after tidal capture of companion GCs is rather short. The merging of GCs with SG stars can provide information on the origin of unique characteristics of some Galactic GCs such as NGC 1851 and M22 (e.g., Carretta et al. 2010b; Bekki & Yong 2012).
Figure 13 also shows two single GCs (M18-GC1 and M18-GC2) which appear to have global morphologies similar to other single GCs (such as M26-GC1) yet show higher central mass densities. Figure 14, describing the projected radial density profiles in these two GCs, demonstrates that the projected stellar densities at R ~ 1 pc are significantly larger than those for GCs in the standard model. The SG stellar system in M18-GC1 shows Σs ~ 4 × 10⁵ M⊙ pc2 at R ~ 1 pc. Given that these two are formed in the massive dwarf model with Mdm = 6 × 10¹⁰ M⊙, this result implies that GCs with rather high densities are likely to be formed in more massive dwarfs. Figure 13 shows that M18-GC6 and M18-GC8 are dominated by SG and FG stars, respectively. In the present study, GCs dominated by FG stars are almost always rather diffuse, and are therefore unlikely to survive tidal destruction by their host dwarfs and thus are unlikely to be identified as GCs later. The animations for the formation of single GC M26-GC1 and binary GC M16-GC4 are given in Appendix A.
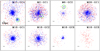 |
Fig. 13 Distributions of FG (red) and SG (blue) stars projected onto the x–y plane for eight selected GCs. The model number and GC ID are given in the upper right corner for each panel. For example, “M15-GC4” means that this GC is GC4 in the model M15. The thick bar in the lower left corner for each panel indicates a size of 10 pc. The three GCs with green circles (M15-GC4, M2-GC1, and M6-GC2) are binary GCs with smaller companions, and the location of a companion GC is shown by a green circle. |
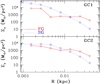 |
Fig. 14 Same as Fig. 7 but for GC1 and GC2 in the model M18. These GCs formed in a more massive dwarf are more massive and have higher central densities than those in the standard model. |
3.4 Mass-density scaling relation
Figure 15 shows a mass-density (MSG−ρSG) relation of SG stellar systems in the simulated GC candidates for the models with Mdm = 2 × 10¹⁰ M⊙. Here ρSG represents the mean stellar densities at half-mass radii (Reff) estimated for stars within 57 pc of the simulated GCs. Therefore, Reff is significantly large for the originally massive GCs and accordingly should not be compared with the observed half-light radii (~ 3 pc) of the present GCs. The GC candidates have 0.5 pc ≤ Reff ≤ 37.5 pc with a mean Reff = 18.2 pc, and some GC candidates have small MSG (≤ 2 × 10⁵ M⊙). The present simulations with a spatial resolution of at most ~1 pc can only allow us to discuss a possible relation between mean mass densities and masses of GCs. Also, it is reasonable to investigate the mass-density relation for SG stellar systems to provide some clues to the origin of the observed mass-density relation of the Galactic GCs, because the majority (~ 70%) of the present stellar populations of the GCs are FG stars (e.g., Carretta et al. 2010a).
Figure 15 shows that ρSG is higher for larger MSG for GCs and theMSG−ρSG relation can be well approximated by  . The physical reason for this relation can be described as follows. In the present models, AGB and SN feedback effects can prevent gas from being converted into new stars, in particular for SG stars. These feedback effects can be more severe for forming GCs with lower masses owing to shallower gravitational potentials. As a result of this, a smaller amount of AGB ejecta can be converted into SG stars within FG stellar systems for forming GCs with lower masses. Thus, less massive GCs with smaller MSG can have lower ρSG.
The derived MSG−ρSG relation canbe compared with the observationally expected one by using the L − σ (i.e., luminosity-dispersion) relation derived by Djorgovski (1993). The Galactic GCs have the L− σ relation:
 (8)
(8)
where β = 1.65 (± 0.15). By using the virial theorem (M ~ Rσ2) and assuming a universal M∕L, the above equation can be rewritten as follows:
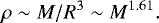 (9)
(9)
This mass-density relation (or size-mass relation of R ∝ M−0.21) is very similar to the simulated one ( ), which implies that the origin of the observed scaling relations of GC (e.g., Djorgovski 1993) could be closely related to the formation processes of SG stars in FG stellar systems.
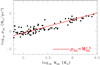 |
Fig. 15 GC candidates with MGC ≥ 2 × 10⁶ M⊙ on the ρSG−MSG plane, whereρSG is the mean mass density of SG stars in an originally massive GC candidate at its half-mass radius (Reff) of SG stars. All SG stars within 57 pc from the center of a GC candidate are used to estimate Reff for SG stars of the GC. These GC candidates are formed in the models with Mdm = 2 × 10¹⁰ M⊙. |
4 Discussion
4.1 Formation of “first-generation” systems in gas-rich, baryon-rich dwarfs at high z
Carretta et al. (2010a) have revealed that the fraction of stars (SG) that were formed from gas chemically polluted by earlier generations of stars (i.e., FG stars, e.g., FRMS and AGB stars) in GCs with internal variation of light elements are quite large (70%). The initial total masses of FG systems required for explaining the observed large SG fractions are at least ten times more massive than the present masses of GCs (e.g., D08; B11). Therefore, previous theoretical models of GC formation (D08; B11) adopted an assumption of initially very massive stellar systems and thereby discussed how SG stars were formed and evolved. The required mass for FG systems appears to be uncomfortably large (“mass budget problem”), and Larsen et al. (2012) suggested that GC formation scenarios based on the very massive FG systems cannot explain the observed small fraction of metal-poor stars and high GC specific frequency in the Fornax dwarf galaxy self-consistently.
There are three ways (scenarios) to overcome this mass budget problem. The first is to adopt a contrived very top-heavy IMF for star formation of FG systems (e.g., Prantzos & Charbonnel 2006). This can significantly reduce the required initial masses of FGs because of a much larger fraction of AGB stars or massive stars, and such a top-heavy IMF is suggested to be possible in low-metallicity environments (e.g., Marks et al. 2012). However, GCs with such a top-heavy IMF are highly likely to disintegrate quickly (Bekki & Norris 2006), and thus rapid accumulation of gas in the FG systems could be less likely. The possibility of gas accumulation in rapidly disintegrating FG systems with a top-heavy IMF needs to be investigated numerically in this first scenario.
The second scenario assumes that gas for SG system formation originates not from massive star clusters but from field stars in the central regions of dwarf galaxies. In this scenario, gaseous ejecta from central field stars and pristine ISM can be converted into new stars in the nuclear regions of dwarfs meaning that SG systems can form and can be identified as nuclear GCs (e.g., Bekki 2006; Bekki et al. 2007; Maxwell et al. 2014). The nucleated dwarfs can be transformed into naked nuclei (i.e., GCs) during theiraccretion onto the Galaxy where their stellar envelopes are completely stripped. There is no budget problem in this scenario, because GC host galaxy itself can provide a large amount of gas for the SG system formation.
The third scenario involves adopting an assumption that GCs with multiple stellar populations are composed of two (or more) populations that were formed at different epochs. It could be possible that the origin of the observed abundance spreads is not due to two different major star formation events with the earlier star formation event influencing the chemical abundances of stars formed in the later one. Bastian et al. 2013 indeed proposed that gas ejecta from massive interacting binaries in a forming GC can chemically pollute some fraction of low-mass pre-main sequence stars, and this can cause stellar populations with different chemical abundances.
If GC progenitors are really as massive as 106−107 M⊙, then the physical mechanisms for their formation need to be understood. The present study suggests that massive gas clumps in gas-rich dwarfs are the formation sites of FG systems. It also suggests that such massive FG systems are more likely to be formed in high-z dwarfs, because they are very gas-rich and have mass densities owing to earlier virialization, meaning that local gravitational instability can lead to the formation of massive clumps.
Furthermore, the simulated FG systems in the present study do not look like spherical systems when SG stars begin to form. FG systems form from mergers of smaller stellar clumps and filaments originating from different regions in a dwarf, meaning that they cannot be fully developed and dynamically relaxed before their AGB stars eject gas. This suggests that the fully developed spherical stellar system adopted in previous theoretical studies of GC formation could be oversimplified or unrealistic. The gas accumulation process within FG systems and secondary SF from gas could be significantly different between fully developed FG systems and growing FG systems. Therefore, future theoretical models of GC formation need to consider hierarchical growth of FG stellar systems through mergers of small clumps and filaments in order to more accurately predict chemical abundances of SG stars formed from gas ejecta from FG stars.
4.2 The dilution of AGB ejecta by pristine gas
Although most of the previous chemical evolution models have shown that dilution of AGB ejecta from FG stars by pristine gas is required to explain the observed star-to-star variation of chemical abundances in GCs (e.g., Bekki et al. 2007; D’Ercole et al. 2010), it remains theoretically unclear where such pristine gas can come from to mix with AGB ejecta in forming GCs (D’Ercole et al. 2011, for a recent summary on this issue). Original GCs can obtain pristine gas by interaction with nearby giant molecular clouds (Bekki & Mackey 2009), via Bondi-accretion of ISM (Pflamm-Altenburg & Kroupa 2009; Conroy & Spergel 2011) and gas accretion from unevolved stars within their FG stellar systems (“self-dilution”; Gratton & Carretta 2010). D’Ercole et al. (2011) concluded that theoretical models based on Bondi-accretion Conroy & Spergel (2011) and self-dilution Gratton & Carretta (2010) cannot explain the observed presence of stars with large He abundances (Y > 0.35) in some GCs. Since these theoretical studies are based on simple analytical models, it is unclear whether the proposed dilution processes can really occur at the epoch of GC formation.
The present study has shown that pristine gas can be captured by FG stellar systems after the ejection of gas from AGB stars in the FG systems and that it is initially located in the low-density regions of local gaseous clumps/filaments (see Fig. 4). ISM that is not expelled from dwarf galaxies by SN explosion and is not converted into new stars owing to its low-density can be captured later by FG stellar systems, meaning that it can be regarded as “pristine”. Therefore, the pristine gas required for the formation of SG stars in the two-stage GC formation originates from clumpy/filamentary gaseous structures developed from local gravitational instability in gas disks of dwarf galaxies. As shown in the present study, the pristine gas comes originally from different local regions within its host dwarf. It is therefore possible that if dwarf galaxies have large radial gradients of chemical abundances, then the pristine gas for GC formation can also have a large dispersion in chemical abundances. We discuss this point below.
Chemical influences of field massive and AGB stars (i.e., those already existing before the formation of FG stars in GCs) on local gaseous clumps/filaments are ignored in the present study. Therefore, it is not clear whether gas in local clumps and filaments that can be later captured by FG stellar systems can be really pristine (i.e., the gaseous chemical abundances similar to those of FG stars) at the formation epoch of SG stars. Given the formation timescale of at least ~ 200 Myr in the two-stage GC formation model, the field massive and AGB stars could possibly increase the dispersion in chemical abundances through mixing of their ejecta with ISM. This point should be properly addressed by our future studies based on full chemodynamical simulations with self-consistent inclusion of both SN explosions and AGB winds.
4.3 High-z gas-rich dwarfs as a preferred formation site of GCs with multiple stellar populations
The present study suggests that gas-rich dwarfs virialized at high z are more likely to form GCs with multiple stellar populations, because massive stellar and gaseous clumps/filaments, which can finally become FG stellar systems, can be developed through local gravitational instability. Massive FG stellar systems cannot only retain gas ejected from AGB stars (D08; B11) but also capture ISM that is mixed with the AGB ejecta for secondary star formation (e.g., Pflamm-Altenburg & Kroupa 2009). Therefore, the initial total masses of FG systems can determine whether the final dense stellar systems can become bona fide GCs with internal variations of light elements (e.g., NGC 1851; Yong et al. 2009, 2015) or those without (e.g., Ruprecht 106; Villanova et al. 2013).
However, this scenario cannot simply explain the existence of the Galactic open cluster NGC 6791 with [Fe/H] = 0.4 and internal variation of light elements (Geisler et al. 2012). Its high metallicity, relatively younger age (4 Gyr), and slightly supersolar [O/Fe] (e.g., Carraro et al. 2006) strongly suggests that this cluster was formed in the central region of the Galaxy, where gas mass fraction should have been low at the cluster formation. Therefore, the physical properties of the low-mass cluster NGC 6791 imply that gas ejected from FG stars is retained by an unknown mechanism (other than massive FG stellar systems). It could be possible that the cluster comes from the inner bulge, where the deep gravitational well of the bulge might have enabled the cluster to retain the AGB ejecta. The origin of this cluster still remains unclear.
4.4 Possible [Fe/H] spread in GC stars
In the present two-stage GC formation scenario, gas from which FG stars can form needs to originate from different local clumps and filaments so that the final GCs composed of FG and SG stars can become as massive as 2 × 10⁶ M⊙. Therefore, it would be inevitable that GCs can have internal [Fe/H] spread, if their host dwarf galaxies have chemical abundance spreads in their gas disks. We investigate quantitatively a possible internal [Fe/H] spread for each of the simulated GCs in the standard model as follows. We first allocate metallicity to each gaseous particle in the disk of the dwarf according to its initial position: at r = R where r (R) is the projected distance (in units of kpc) from the center of the disk, the metallicity of the gas particle is given as:
![Mathematical equation: \begin{equation*} \textrm{[Fe/H]}_{r\;{=}\;R} = \textrm{[Fe/H]}_{\textrm{d,} r}\,={\rm\,0} + \alpha \times {R}. \; \end{equation*}](/articles/aa/full_html/2019/02/aa29898-16/aa29898-16-eq13.png) (10)
(10)
We then search for the initial locations (within the gas disk at T = 0) of FG and SG stars in a GC and thereby investigate initial [Fe/H] of all stars in the GC by using the above equation. We consider that the slope α is a free parameter and that [Fe/H]d, r=0 is set to be − 1.45 for this model. We investigate the model with α = −0.02 and − 0.04 (dex kpc−1), the observed value for the Galaxy (e.g., Andrievsky et al. 2004).
As shown in Fig. 16, internal [Fe/H] spread (σ[Fe/H]) for each of the seven GC candidates in the standard model depends on α such that σ[Fe/H] is larger for steeper initial metallicity gradients. This result is essentially consistent with our previous simulations (without the formation of SG stars) on the origin of abundance spreads in heavy elements for the Galactic GCs (Bekki 2012). For example, σ[Fe/H] can be ~0.02 dex for α = −0.02 and ~ 0.04 dex for α = −0.04 in the standard model. The mean [Fe/H] ([Fe/H]m) does not depend strongly on α in this model. These results imply that the observed σ[Fe/H] in GCs can provide some constraints on α in their host dwarfs at the epoch of GC formation. The present study has shown that GC formation can be possible when their host dwarfs are relatively gas-rich and thus in the early formation phases. It is possible that α is rather small in the early phase of dwarf formation owing to less advanced chemical enrichment. The present study suggests that if the formation of GCs with SG stars is possible mostly in the early formation phases of dwarfs, then σ[Fe/H] should be small.
These results on σ[Fe/H] could provide a clue to the origin of recent observations on possible Ca abundance spreads in some Galactic GCs (e.g., Lee et al. 2009). In the present two-stage GC formation model, however, σ[Fe/H] can be at most ~0.1 dex for α > −0.1 (dex kpc−1). Therefore, the present study cannot explain the observed larger spreads in heavy elements in some massive Galactic GCs: 1.5 dex in ω Cen (Norris & Da Costa 1995), 0.2 dex in M54 (e.g., Bellazzini et al. 2008), 0.2 dex for Ca in NGC 2419 (e.g., Cohen & Kirby 2012), 0.15 dex in M22 (e.g., Da Costa et al. 2009; Marino et al. 2011), and 0.3 dex in Terzan 5 (Ferraro et al. 2009). Such large spreads in these GCs cannot be simply explained by initial abundance spreads of heavy elements in the gas disks of their host galaxies. Other physical mechanisms such as GC formation in the central regions of galaxies where continuous gas supply is possible would be required for explaining these GCs with large abundance spreads of heavy elements.
It should be noted here that possible internal metallicity spreads among FG stars (i.e., those generated during star formation in GC-forming molecular clouds) are not considered in the above discussion: σ[Fe/H] in Fig. 16 can be a minimum possible spread. Our recent hydrodynamical simulations of GC formation within fractal molecular clouds were used to investigate [Fe/H] spreads among FG stars in simulated GCs and found that the typical spread is less than 0.05 dex (Bekki 2017b). This small spread of 0.05 dex is comparable to the derived initial [Fe/H] spread of GC-forming molecular clouds in Fig. 16.
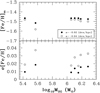 |
Fig. 16 Dependencies of mean [Fe/H] ([Fe/H]m; upper panel)and internal [Fe/H] spread (σ[Fe/H]; lower panel) among GC stars on MSG in the seven GC candidates of the standard model for α = −0.02 (filled circles) and α = −0.04 (open circles), where α is the slope of an initial metallicity gradient (dex kpc−1). |
4.5 Comments on the latest observations of star clusters in the Magellanic Clouds
Intermediate-age and young Massive star clusters in the LMC are observed to have extended main sequence turn-offs (eMSTOs). Whether multiple generations of stars (i.e., internal age spread) or stellar rotation can be responsible for the eMSTO phenomena remains unclear (Mackey et al. 2008; Bastian et al. 2013; Goudfrooij et al. 2014; Cabrera-Ziri et al. 2016; Li et al. 2016). Recently, FB17 discovered young stellar objects (YSOs) within the central regions (less than the central 1 pc) of seven LMC clusters with ages ranging from 100 Myr to 1 Gyr. Given that the ages of YSOs are less than 1 Myr, their results confirm that there can bevery young stellar populations in some of the LMC clusters. It has recently been confirmed that the YSOs cannot be AGB stars, because no AGB candidates were found in the color magnitude diagrams of the stars close to YSOs for the seven LMC clusters (Bekki et al. 2017).
Furthermore, Milone et al. (2017) found that the presence of younger stellar populations and stellar rotation is necessary to reproduce the observed color magnitude relation of the LMC younger cluster, NGC 1866. These latest observations demonstrate that some of the LMC clusters have multiple generations of stars, although the origin of the multiple stellar populations with different ages is not clear.
FB17 found that star clusters with YSOs are not necessarily surrounded by high-density cold gas and thus suggested that new star formation from accreted gas from ISM cannot be the major mechanism for the multiple generations of stars observed. The present study demonstrates that secondary star formation is possible from pure AGB ejecta from forming GCs in gas-rich dwarf galaxies. However, some of the star clusters with YSOs in FB17 are less massive (< 105 M⊙), meaning that they cannot retain AGB ejecta. Therefore, the physical origin of secondary star formation in star clusters with YSOs remains unclear. One possibility is that these star clusters interacted with nearby massive molecular clouds to “snatch” gas from the clouds for secondary star formation (Bekki & Mackey 2009).
5 Conclusions
We have investigated how GCs with multiple stellar populations can be formed from star-forming gas clouds by adopting a novel method to resolve the two-stage GC formation in numerical simulations of gas-rich dwarf disk galaxies. A principal assumption in the present simulations is that SG stars can be formed from gas ejected from FG AGB stars in forming GCs. The present numerical simulations are different from previous ones in that they enable us to investigate, for the first time, both the formation process of FG stars and that of SG stars from gaseous ejecta of FG stars in a self-consistent manner. The principal results are summarized as follows.
- 1.
The formation process of GCs is basically two-stage. First, new stars (i.e., FG stars) can form efficiently from the high-density regions of gaseous clumps and filaments developed through local gravitational instability in the gas disks of dwarfs. The local stellar clumps (or sub-clusters) and filaments merge with one another to form massive diffuse stellar systems with masses larger than 106 M⊙. Then, gas ejected from AGB stars evolved from these FG stars can finally sink into the potential well of the FG stellar system and can subsequently be converted into new stars corresponding to SG stars. The formation timescale for GCs with FGand SG stars is about 200 Myr in the present two-stage GC formation process. Although the formation of SG starsin FG stellar systems has already been suggested and investigated by previous studies (e.g., D08; B11), the present study has shown, for the first time, the entire two-stage formation process of GCs with FG and SG stars. It should be noted, however, that SG stars are assumed to be formed from AGB ejecta only if local gas density exceeds a threshold gas density in the present study. This assumption could be over-simplified for star formation in existing dense stellar systems.
- 2.
Gas in the low-density regions of local clumps and filaments does not form stars, and consequently can be captured later by nearby FG stellar systems in forming GCs. Such gas can therefore be used as “pristine gas” for mixing of AGB ejecta to form SG stars in the central regions of FG stellar systems. The present simulations suggest that AGB ejecta can be diluted by ISM that (i) does not participate in the formation of FG stars, (ii) is not expelled from GC host galaxies through SN explosions, and (iii) is close to forming FGs. AGB ejecta both from FG stars in a GC and from field stars (that do not finally become member stars of the GC) can contribute to the formation of SG stars in the GC. More sophisticated high-resolution simulations will be necessary to confirm that such ISM can really have chemicalabundances similar to those of FG stars.
- 3.
SG stellar systems in simulated GCs can have more compact spatial distributions and larger rotational amplitudes in comparison with the FG stellar systems. These structural and kinematical differences between FG and SG stellar systems are due largely to dissipative formation of SG stars in FG stellar systems. The mass fractions and spatial distributions of SG stars within GCs are diverse, and some diffuse GCs can have no/few SG stars. FG stellar systems can haverotational kinematics in some massive GCs owing to mergers of sub-clusters at their formation phases.
- 4.
SG stellar systems with larger total masses (MSG) are likelyto have higher mass densities (ρSG), and the mass-density relation can be roughly described as
 . More massive GCs are likely to be formed in more massive dwarfs. Given the observed mass-metallicity relation of dwarfs (i.e., more massive dwarfs being more metal-rich), this result suggests that more massive GCs are likely to be more metal-rich. Thus, the origin of the observed possible mass-metallicity relation in metal-poor GCs (“blue tilt”) could berelated to a trend for more massive GCs to be formed in more massive dwarfs.
 - 5.
It is inevitable that massive GCs can show internal [Fe/H] spreads in the present two-stage GC formation because FG stars in such GCs need to form from gas clumps and filaments initially located in different regions of dwarfs. The [Fe/H] spreads (σ[Fe/H]) depend on radial metallicity gradients (α dex kpc−1) in disks of GC host dwarfs such that σ[Fe/H] is larger for steeper gradients. The possible σ[Fe/H] is, however, as small as 0.04 dex for α = −0.04 for GCs formed in dwarfs with Mdm = 2 × 10¹⁰ M⊙. It should be noted here that our simulations do not include self-enrichment by SNe in forming GCs. Therefore, the above σ[Fe/H] is a minimum possible value.
- 6.
Binary GC formation via the capture of a smaller GC by a larger one is clearly seen in the present hydrodynamical simulations in which GC formation from ISM and AGB ejecta is self-consistently investigated. However, the timescale of a binary GC status is short (~108 yr) because of the subsequent rapid GC–GC merger in the halo of FG stellar systems. The merger of GCs with compact SG stellar systems (i.e., merging after SG formation) is demonstrated to be possible, which provides a clue to the origin of some Galactic GCs with unique characteristics of multiple stellar populations (e.g., NGC 1851 and M22).
- 7.
There is a threshold mass of GC host galaxies (Mh,min) beyond which the formation of GCs with FG and SG is possible. The possible Mh,min including dark matter halos of dwarf disks can be [5−23] × 109 M⊙. Below this Mh,min, diffuse GC-like objects can be formed in disks, but the total masses of SG stars in these objects are much less than ~105 M⊙. They are highly likely to be easily destroyed by the tidal fields of their host galaxies and thus unlikely to be the present GCs with multiple stellar populations. The baryonic fraction (fb) and gas mass fractions (fg) of dwarfs’ disks are also key parameters that determine whether GCs can have SG stars. Galaxies with higher fb are more likely to form GCs.
- 8.
The required high fb and fg imply that dwarf galaxies at high z (>5) could be the preferred formation sites of GCs with multiple stellar population. The required fb and fg also suggest that the physical properties of GCs predicted in previous cosmological simulations (e.g., Bekki et al. 2008) would not be particularly robust because the simulations did not properly consider these threshold values. The present constrained simulations, however, did not allow us to investigate whether such high fb and fg can really be achieved within high-z dwarfs in a cosmological context.
- 9.
Both AGB and SN feedback effects are important for the formation of GCs with FG and SGs stars in the simulated two-stage GC formation process, because they can suppress the formation of SG stars in the central regions of the FG stellar systems. It is, however, unclear how AGB stars and SNe in FG systems can influence the chemical abundances of gas from which SG stars can form in the present study. Thus, although the present study has shown that the formation of “multi-generations” of stars is possible in dwarf galaxies, it remains unclear whether the simulated different generations of stars in GCs have chemical abundances consistent with the observed ones in GCs.
- 9.
Previoustheoretical models of GC formation with multiple stellar populations assumed fully developed massive stellar systems in order to discuss chemical and dynamical properties of different stellar populations (D08; B11; Bastian et al. 2013). The present results suggest that such an assumption could be unrealistic. Given that FG stellar systems form through mergers of smaller clumps and filament-like structures, accretion of AGB ejecta and mixing of the ejecta with pristine ISM in forming FG stellar systems can be significantly more complicated than what is described in previousmodels (D08; B11). Furthermore, AGB ejecta that can be used for the formation of SG stars in a GC can originate not only from the stars of the FG system but also from those which do not finally become the members of the FG system. Although this alleviates the mass budget problem, the original masses of FG systems should still be significantly more massive than the present GCs. Future chemical evolution models of GCs based on the formation of SG systems from gas ejected from FG stars thus need to incorporate the above formation process of FG systems.
The present study is a first step toward comprehensive modeling of the sequential formation processes of FG and SG stars of GCs in galaxies. The numerical study presented here would be rather idealized and less realistic in terms of modeling AGB ejecta and star formation in dense stellar systems. Furthermore, the present model is incapable of investigating the observed anti-correlations between light elements (e.g., C, N, and O) of GCs with multiple stellar populations. We therefore plan to investigate the origin of the anti-correlations in the multiple stellar populations of GCs by using fully self-consistent chemodynamical models with a more sophisticated model for the evolution of AGB ejecta. We also need to perform hydrodynamical simulations of GC formation for other self-enrichment scenarios (e.g., FRMS, MIB) in order to assess the validity of each of these scenarios.
Movies
The animation file gc1 Access Supplementary Material
The animation file gc2 Access Supplementary Material
Acknowledgements
I am grateful to the anonymous referee for constructive and useful comments. The preliminary results of the present simulations have been reported in the Special Session 1 of IAU XXVIII meeting (“Origin and Complexity of Massive Star Clusters”) held in Beijing, China, on August 20–24, 2012. I am grateful to participants of the meeting who discussed the results with me during the meeting. Numerical simulations reported here were carried out on the three GPU clusters, Pleiades, Fornax, and gSTAR, kindly made available by International Center for radio astronomy research (ICRAR) at The University of Western Australia, iVEC, and the Center for Astrophysics and Supercomputing in the Swinburne University, respectively.
Appendix A Two animations
We here present two animations of typical GC formation in the present numerical simulations in order to help readers to understand the key formation processes of GCs with FG and SG stars.
A.1 The two-stage GC formation process
The animation file gc1.avi clearly describes the two-stage GC formation process for one of the GCs (GC1, shown in Fig. 13 as M26-GC1) formed in the model M26. In this animation, the left andright flames describe the time evolution of particle distributions projected onto the x-y plane for ISM (blue), FG stars formed from ISM (magenta), AGB ejecta (green), and SG stars formed from AGB ejecta of FG stars (cyan) for the large-scale (left) and small-scale (right) views. The time indicated in the upper part of each frame is given in units of Myrand the white bar shows a physical scale (1 kpc in the left and 10 pc in the right). The center of each frame is coincident with the center of mass of the simulated GC. This GC is the most massive one with 1.9 × 10⁷ M⊙ for the initial FG stars and 2.2 × 10⁶ M⊙ for the SG stars. Although, the total masses of FG and SG stars can decrease significantly from these larger masses owing to later dynamical evolution, this GC candidate is highly likely to become one of the present massive GCs.
A.2 Formation and evolution of binary GCs
The animation file gc2.avi describes formation and evolution of a binary GC (GC4, shown in Fig. 13 as M15-GC4) formed in model M15. It is not easy to identify a binary GC in a simulation because simulation data is output at every 1.4 × 10⁸ yr for most models (at every 56 Myr for the standard model) in the present study. This binary GC is one of the GCs which happened to be identified during the GC identification process in the present study. In this animation, the left and right frames describe the time evolution of particle distributions for ISM (blue), FG stars formed from gas (magenta), AGB ejecta (green), and SG stars formed from AGB ejecta of FG stars (cyan) for the x-y (left) and x-z projections (right). The time indicated in the upper part of each frame is given in units of Myr and the white bar shows a physical size of 10 pc. The center of each frame is coincident with the center of mass of the simulated GC. This GC is also massive with 4.7 × 10⁶ M⊙ for FG stars and 1.5 × 10⁶ M⊙ for SG stars. It is clear that a smaller GC with SG stars is tidally captured by a larger GC with SG stars. Thus, this is a merging between GCs with SG stars (i.e., after SG formation in FG stellar systems).
References
- Anderson, J., & King, I. R. 2003, AJ, 126, 772 [NASA ADS] [CrossRef] [Google Scholar]
- Andrievsky, S.M., Luck, R. E., Martin, P., & Lépine, J. R. D. 2004, A&A, 413, 159 [NASA ADS] [CrossRef] [EDP Sciences] [Google Scholar]
- Bastian, N., Lamers, H. J. G. L. M., de Mink, S. E., et al. 2013, MNRAS, 436, 2398 [NASA ADS] [CrossRef] [MathSciNet] [Google Scholar]
- Beasley, M. A., Baugh, C. M., Forbes, D. A., Sharples, R. M., & Frenk, C. S. 2002, MNRAS, 333, 383 [NASA ADS] [CrossRef] [MathSciNet] [Google Scholar]
- Bedin, L. R., Piotto, G., Anderson, J., et al. 2004, ApJ, 605, L125 [NASA ADS] [CrossRef] [Google Scholar]
- Bekki, K. 2006, MNRAS, L367, 24 [Google Scholar]
- Bekki, K. 2007, PASA, 24, 77 [NASA ADS] [CrossRef] [Google Scholar]
- Bekki, K. 2009, MNRAS, 399, 2221 [NASA ADS] [CrossRef] [Google Scholar]
- Bekki, K. 2011, MNRAS, 412, 2241 (B11) [NASA ADS] [CrossRef] [Google Scholar]
- Bekki, K. 2012, MNRAS, 421, L44 [NASA ADS] [CrossRef] [Google Scholar]
- Bekki, K. 2013, MNRAS, 432, 2298 [NASA ADS] [CrossRef] [Google Scholar]
- Bekki, K. 2017a, MNRAS, 467, 1857 [NASA ADS] [Google Scholar]
- Bekki, K. 2017b, MNRAS, 469, 2933 [NASA ADS] [CrossRef] [Google Scholar]
- Bekki, K., & Couch, W. C. 2001, ApJ, 557, L19 [NASA ADS] [CrossRef] [Google Scholar]
- Bekki, K., & Freeman, K. C. 2003, MNRAS, 346, L11 [NASA ADS] [CrossRef] [Google Scholar]
- Bekki, K., & Mackey, A. D. 2009, MNRAS, 394, 124 [NASA ADS] [CrossRef] [Google Scholar]
- Bekki, K., & Norris, J. E. 2006, ApJ, 637, L109 [NASA ADS] [CrossRef] [Google Scholar]
- Bekki, K., & Stanimirovic, S. 2009, MNRAS, 395, 342 [NASA ADS] [CrossRef] [Google Scholar]
- Bekki, K., & Yong, D. 2012, MNRAS, 419, 2063 [NASA ADS] [CrossRef] [Google Scholar]
- Bekki, K., Forbes, D. A., Beasley, M. A., & Couch, W. J. 2002, MNRAS, 335, 1176 [NASA ADS] [CrossRef] [Google Scholar]
- Bekki, K., Campbell, S. W., Lattanzio, J. C., & Norris, J. E. 2007, MNRAS, 377, 335 [NASA ADS] [CrossRef] [Google Scholar]
- Bekki, K., Yahagi, H., Nagashima, M., & Forbes, D. A. 2008, MNRAS, 387, 1131 [NASA ADS] [CrossRef] [Google Scholar]
- Bekki, K., Jerabkova, T., & Kroupa, P. 2017, MNRAS, 471, 2242 [NASA ADS] [CrossRef] [Google Scholar]
- Bellazzini, M., Ibata, R. A., Chapman, S. C., et al. 2008, AJ, 136, 1147 [NASA ADS] [CrossRef] [Google Scholar]
- Bellini, A., Piotto, G., Bedin, L. R., et al. 2009, A&A, 507, 1393 [NASA ADS] [CrossRef] [EDP Sciences] [Google Scholar]
- Böker, T. 2008, ApJ, 672, 111 [Google Scholar]
- Bragaglia, A., Carretta, E., Gratton, R. G., et al. 2010, ApJ, 720, L41 [NASA ADS] [CrossRef] [Google Scholar]
- Bromm, V., & Clarke, C. J. 2002, ApJ, 566, L1 [NASA ADS] [CrossRef] [Google Scholar]
- Burkert, A. 1994, MNRAS, 266, 877 [NASA ADS] [Google Scholar]
- Cabrera-Ziri, I., Niederhofer, F., Bastian, N., et al. 2016, MNRAS, 459, 4218 [NASA ADS] [CrossRef] [Google Scholar]
- Carretta, E. 2015, ApJ, 810, 148 [NASA ADS] [CrossRef] [Google Scholar]
- Carretta, E., Bragaglia, A., Gratton, R. G., et al. 2009, A&A, 505, 117 [NASA ADS] [CrossRef] [EDP Sciences] [Google Scholar]
- Carretta, E., Bragaglia, A., Gratton, R. G., et al. 2010a, A&A, 516, A55 [NASA ADS] [CrossRef] [EDP Sciences] [Google Scholar]
- Carretta, E., Gratton, R. G., Lucatello, S., et al. 2010b, ApJ, 722, L1 [NASA ADS] [CrossRef] [Google Scholar]
- Cohen, J. G. 1981, ApJ, 247, 869 [NASA ADS] [CrossRef] [Google Scholar]
- Cohen, J. G., & Kirby, E. N. 2012, ApJ, 760, 86 [NASA ADS] [CrossRef] [Google Scholar]
- Conroy, C., & Spergel, D. N. 2011, ApJ, 726, 36 [NASA ADS] [CrossRef] [Google Scholar]
- Cortese, L., Bekki, K., Boselli, A., et al. 2016, MNRAS, 459, 3574 [NASA ADS] [CrossRef] [Google Scholar]
- Cottrell, P. L.,& Da Costa, G. S. 1981, ApJ, 245, L79 [NASA ADS] [CrossRef] [Google Scholar]
- Da Costa, G. S. Held, E. V. Saviane, I., & Gullieuszik, M. 2009, ApJ, 705, 1481 [NASA ADS] [CrossRef] [Google Scholar]
- D’Antona, F., & Caloi, V. 2004, ApJ, 611, 871 [NASA ADS] [CrossRef] [Google Scholar]
- D’Antona, F., & Caloi, V. 2008, MNRAS, 390, 693 [NASA ADS] [CrossRef] [Google Scholar]
- Decressin, T., Meynet, G., Charbonnel, C., Prantzos, N., & Ekström, S. 2007, A&A, 464, 1029 [NASA ADS] [CrossRef] [EDP Sciences] [Google Scholar]
- Denissenkov, P. A., & Hartwick, F. D. A. 2014, MNRAS, L437, 21 [Google Scholar]
- D’Ercole, A., Vesperini, E., D’Antona, F., McMillan, S. L. W., & Recchi, S. 2008, MNRAS, 391, 825 (D08) [NASA ADS] [CrossRef] [Google Scholar]
- D’Ercole, A., D’Antona, F., Ventura, P., Vesperini, E., & McMillan, S. L. W. 2010, MNRAS, 407, 854 [NASA ADS] [CrossRef] [MathSciNet] [Google Scholar]
- D’Ercole, A., D’Antona, F., & Vesperini, E. 2011, MNRAS, 415, 1304 [NASA ADS] [CrossRef] [MathSciNet] [Google Scholar]
- Djorgovski, S. 1993, ASP Conf. Ser., 48, 496 [NASA ADS] [Google Scholar]
- D’Orazi, V., Gratton, R., Lucatello, S., et al. 2010, ApJ, 719, L213 [NASA ADS] [CrossRef] [Google Scholar]
- Elmegreen, B. G., Malhotra, S., & Rhoads, J. 2012, ApJ, 757, 9 [NASA ADS] [CrossRef] [Google Scholar]
- Ferraro, F. R., Dalessandro, E., Mucciarelli, A., et al. 2009, Nature, 462, 483 [NASA ADS] [CrossRef] [PubMed] [Google Scholar]
- For, B.-Q., & Bekki, K. 2015, MNRAS, 468, L11 (FB17) [NASA ADS] [CrossRef] [Google Scholar]
- Forbes, D. A., & Bridges, T. 2010, MNRAS, 404, 1203 [NASA ADS] [Google Scholar]
- Forbes, D. A., Bastian, N., Gieles, M., et al. 2018, Proc. Roy. Soc. A, 474, 2210 [Google Scholar]
- Freeman, K. C. 1993, ASP Conf. Ser., 48, 608 [Google Scholar]
- Geisler, D., Villanova, S., Carraro, G., et al. 2012, ApJ, 756, L40 [NASA ADS] [CrossRef] [Google Scholar]
- Georgiev, I. Y., Puzia, T. H., Hilker, M., & Goudfrooij, P. 2009, MNRAS, 392, 879 [NASA ADS] [CrossRef] [MathSciNet] [Google Scholar]
- Girardi, L., Eggenberger, P., & Miglio, A. 2011, MNRAS, 412, L103 [NASA ADS] [Google Scholar]
- Goudfrooij, P., Girardi, L., Kozhurina-Platais, V., et al. 2014, ApJ, 797, 35 [NASA ADS] [CrossRef] [Google Scholar]
- Governato, F., Brook, C., Mayer, L., et al. 2010, Nature, 463, 203 [NASA ADS] [CrossRef] [PubMed] [Google Scholar]
- Gratton, R. G., & Carretta, E. 2010, A&A, 521, A54 [NASA ADS] [CrossRef] [EDP Sciences] [Google Scholar]
- Gratton, R. G., Carretta, E., & Bragaglia, A. 2012, A&ARv, 20, 50 (GCB12) [CrossRef] [Google Scholar]
- Gratton, R. G., Lucatello, S., Sollima, A., et al. 2013, A&A, 549, A41 [NASA ADS] [CrossRef] [EDP Sciences] [Google Scholar]
- Griffen, B. F., Drinkwater, M. J., Thomas, P. A., Helly, J. C., & Pimbblet, K. A. 2010, MNRAS, 405, 375 [NASA ADS] [Google Scholar]
- Guo, Q., Gonzalez-Perez, V., Guo, Q. et al. 2016, MNRAS, 461, 3457 [NASA ADS] [CrossRef] [Google Scholar]
- Harris, W. E. 1999, Ap&SS, 267, 95 [NASA ADS] [CrossRef] [Google Scholar]
- Harris, W. E., & van den Bergh, S. 1981, AJ, 86, 1627 [NASA ADS] [CrossRef] [Google Scholar]
- Harris, W. E., Whitmore, B. C., Karakla, D., et al. 2006, AJ, 636, 90 [NASA ADS] [CrossRef] [Google Scholar]
- Hilker, M., Kayser, A., Richtler, T., & Willemsen, P. 2004, A&A, 422, L9 [NASA ADS] [CrossRef] [EDP Sciences] [Google Scholar]
- Hurley, J. R., & Bekki, K. 2008, MNRAS, L389, 61 [NASA ADS] [CrossRef] [Google Scholar]
- Hurley, J. R., & Shara, M. M. 2012, MNRAS, 425, 2872 [NASA ADS] [CrossRef] [Google Scholar]
- Johnson, C. I., & Pilachowski, C. A. 2010, ApJ, 722, 1373 [NASA ADS] [CrossRef] [Google Scholar]
- Johnson, C. I., Rich, R. M., Pilachowski, C. A., et al. 2015, AJ, 150, 63 [NASA ADS] [CrossRef] [Google Scholar]
- Karakas, A., Fenner, Y., Sills, A., Campbell, S. W., & Lattanzio, J. 2006, ApJ, 652, 1413 [Google Scholar]
- Keller, S. C., Mackey, A. D., & Da Costa, G. S. 2012, ApJ, 761, 5 [NASA ADS] [CrossRef] [Google Scholar]
- Khalaj, P., & Baumgardt, H. 2016, MNRAS, 457, 479 [NASA ADS] [CrossRef] [Google Scholar]
- Kraft, R. P. 1994, PASP, 106, 553 [NASA ADS] [CrossRef] [Google Scholar]
- Krause, M., Charbonnel, C., Decressin, T., Meynet, G., & Prantzos, N. 2013, A&A, 552, A121 [NASA ADS] [CrossRef] [EDP Sciences] [Google Scholar]
- Kravtsov, A. V., & Gnedin, Y. 2005, ApJ, 623, 650 [NASA ADS] [CrossRef] [Google Scholar]
- Kruijssen, J. M., D., Pelupessy, F. I., Lamers, H. J. G. L. M., et al. 2012, MNRAS, 421, 1927 [NASA ADS] [CrossRef] [Google Scholar]
- Larsen, S. S., Strader, J., & Brodie, J. P. 2012, A&A, 544, L14 [NASA ADS] [CrossRef] [EDP Sciences] [Google Scholar]
- Lee, Y.-W., Joo, J.-M., Sohn, Y.-J., et al. 1999, Nature, 402, 55 [NASA ADS] [CrossRef] [Google Scholar]
- Lee, Y.-W., Joo, S. J., Han, S. I., et al. 2005, ApJ, 621, L57 [NASA ADS] [CrossRef] [Google Scholar]
- Lee, J-W., Kang, Y-W., Lee, J., & Lee, Y-W. 2009, Nature, 462, 480 [NASA ADS] [CrossRef] [PubMed] [Google Scholar]
- Li, C., de Grijs, R., Deng, L., et al. 2016, Nature, 529, 502 [NASA ADS] [CrossRef] [Google Scholar]
- Mackey, A. D., Broby Nielsen, P., Ferguson, A. M. N., & Richardson, J. C. 2008, ApJ, 681, L17 [NASA ADS] [CrossRef] [Google Scholar]
- Mackey, A. D., Da Costa, G. S., Ferguson, A. M. N., & Yong, D. 2013, ApJ, 762, 65 [NASA ADS] [CrossRef] [Google Scholar]
- Marino, A. F., Sneden, C., Kraft, R. P., et al. 2011, A&A, 532, A8 [NASA ADS] [CrossRef] [EDP Sciences] [Google Scholar]
- Marino, A. F., Milone, A. P., Piotto, G., et al. 2012, ApJ, 746, 14 [NASA ADS] [CrossRef] [Google Scholar]
- Marino, A. F., Milone, A. P., Karakas, A. I. et al. 2015, MNRAS, 450, 815 [NASA ADS] [CrossRef] [Google Scholar]
- Marks, M., Kroupa, P., Dabringhausen, J., & Pawlowski, M. S. 2012, MNRAS, 422, 2246 [NASA ADS] [CrossRef] [Google Scholar]
- Martell, S. L., Smolinski, J. P., Beers, T. C., & Grebel, E. K. 2011, A&A, 534, A136 [NASA ADS] [CrossRef] [EDP Sciences] [Google Scholar]
- Maxwell, A. J., Wadsley, J., Couchman, H. M. P., & Sills, A. 2014, MNRAS, 439, 2043 [NASA ADS] [CrossRef] [Google Scholar]
- Meylan, G., & Mayor, M. 1986, A&A, 166, 122 [NASA ADS] [Google Scholar]
- Milone, A. P., Bedin, L. R., Piotto, G., & Anderson, J. 2009, A&A, 497, 755 [NASA ADS] [CrossRef] [EDP Sciences] [Google Scholar]
- Milone, A. P., Bedin, L. R., Piotto, G., et al. 2015, MNRAS, 450, 3750 [NASA ADS] [CrossRef] [Google Scholar]
- Milone, A., Marino, A. F., D’Antona, F., et al. 2017, MNRAS, 465, 4363 [NASA ADS] [CrossRef] [Google Scholar]
- Moster, B., Naab, T., & White, S. D. M. 2013, MNRAS, 428, 3121 [NASA ADS] [CrossRef] [Google Scholar]
- Mucciarelli, A., Origlia, L., Ferraro, F. R., & Pancino, E. 2009, ApJ, 695, L134 [NASA ADS] [CrossRef] [Google Scholar]
- Narayanan, D. Bothwell, M., & Davé, R. 2012, MNRAS, 426, 1178 [NASA ADS] [CrossRef] [Google Scholar]
- Navarro, J. F., Frenk, C. S., & White, S. D. M. 1996, ApJ, 462, 563 [NASA ADS] [CrossRef] [Google Scholar]
- Noguchi, M. 1999, ApJ, 514, 77 [NASA ADS] [CrossRef] [Google Scholar]
- Norris, J. E. 2004, ApJ, 612, 25 [Google Scholar]
- Norris, J. E., & Da Costa, G. S. 1995, ApJ, 441, L81 [NASA ADS] [CrossRef] [Google Scholar]
- Oh, S-H., Brook, C., Governato, F., et al. 2011, AJ, 142, 24 [NASA ADS] [CrossRef] [Google Scholar]
- Pancino, E., Galfo, A., Ferraro, F. R., & Bellazzini, M. 2007, ApJ, 661, L155 [NASA ADS] [CrossRef] [Google Scholar]
- Papastergis, E., Cattaneo, A., Huang, S., Giovanelli, R., & Haynes, M. P. 2012, ApJ, 759, 138 [NASA ADS] [CrossRef] [Google Scholar]
- Pflamm-Altenburg, J., & Kroupa, P. 2009, MNRAS, 397, 394 [NASA ADS] [CrossRef] [Google Scholar]
- Piotto, G., Villanova, S., Bedin, L. R., et al. 2005, ApJ, 621, 777 [NASA ADS] [CrossRef] [Google Scholar]
- Piotto, G., Bedin, L. R., Anderson, J., et al. 2007, ApJ, 661, L53 [NASA ADS] [CrossRef] [Google Scholar]
- Prantzos, N., & Charbonnel, C. 2006, A&A, 458, 135 [NASA ADS] [CrossRef] [EDP Sciences] [Google Scholar]
- Renaud, F., Bournaud, F., & Duc, P.-A. 2015, MNRAS, 446, 2038 [NASA ADS] [CrossRef] [Google Scholar]
- Renzini, A., D’Antona, F., Cassisi, S., et al. 2015, MNRAS, 454, 4197 [NASA ADS] [CrossRef] [Google Scholar]
- Rosen, A., & Bregman, J. N. 1995, ApJ, 440, 634 [NASA ADS] [CrossRef] [Google Scholar]
- Saitoh, T. R., Daisaka, H., Kokubo, E., et al. 2011, IAU Symp., 270, 483 [NASA ADS] [Google Scholar]
- Salucci, P., & Burkert, A. 2000, ApJ, 537, L9 [NASA ADS] [CrossRef] [Google Scholar]
- Searle, L., & Zinn, R. 1978, ApJ, 225, 357 [NASA ADS] [CrossRef] [Google Scholar]
- Shingles, L. J., Karakas, A. I., Hirschi, R., et al. 2014, ApJ, 795, 34 [NASA ADS] [CrossRef] [Google Scholar]
- Shlosman, I., & Noguhi, M. 1993, ApJ, 414, 474 [NASA ADS] [CrossRef] [Google Scholar]
- Smith, G. H. 1987, PASP, 99, 67 [NASA ADS] [CrossRef] [Google Scholar]
- Sollima, A., Ferraro, F. R., Bellazzini, M., et al. 2007, ApJ, 654, 915 [NASA ADS] [CrossRef] [Google Scholar]
- Strader, J., Brodie, J. P., Spitler, L., & Beasley, M. A. 2006, ApJ, 132, 2333 [Google Scholar]
- Sugimoto, D., Chikada, Y., Makino, J., et al. 1990, Nature, 345, 33 [NASA ADS] [CrossRef] [Google Scholar]
- Sutherland, R. S., & Dopita, M. A. 1993, ApJS, 88, 253 [NASA ADS] [CrossRef] [Google Scholar]
- Thornton, K., Gaudlitz, M., Janka, H.-Th., & Steinmetz, M. 1998, ApJ, 500, 95 [NASA ADS] [CrossRef] [Google Scholar]
- Tonini, C. 2013, ApJ, 762, 39 [NASA ADS] [CrossRef] [Google Scholar]
- Tremonti, C. A., Heckman, T. M., Kauffmann, G., et al. 2004, ApJ, 613, 898 [NASA ADS] [CrossRef] [Google Scholar]
- van den Bergh, S. 2010, The Galaxies in the Local Group (Cambridge, UK: Cambridge University Press), 35 [Google Scholar]
- van den Hoek, L. B., & Groenewegen, M. A. T. 1997, A&AS, 123, 305 (VG97) [NASA ADS] [CrossRef] [EDP Sciences] [Google Scholar]
- Ventura, P., & D’Antona, F. 2010, MNRAS, 402, L72 [NASA ADS] [CrossRef] [Google Scholar]
- Vesperini, E., McMillan, S. L. W., D’Antona, F., & D’Ercole, A. 2010, ApJ, 718, L112 [NASA ADS] [CrossRef] [Google Scholar]
- Vesperini, E., McMillan, S. L. W., D’Antona, F., & D’Ercole, A. 2013, MNRAS, 429, 1913 [NASA ADS] [CrossRef] [Google Scholar]
- Villanova, S., Geisler, D., Carraro, G., Moni Bidin, C., & Munoz, C. 2013, ApJ, 778, 186 [NASA ADS] [CrossRef] [Google Scholar]
- Yong, D., Grundahl, F., D’Antona, F., et al. 2009, ApJ, 695, L62 [NASA ADS] [CrossRef] [Google Scholar]
- Yong, D., Grundahl, F., & Norris, J. E. 2015, MNRAS, 446, 3319 [NASA ADS] [CrossRef] [Google Scholar]
- Yozin, C., & Bekki, K. 2014, MNRAS, 443, 522 [NASA ADS] [CrossRef] [Google Scholar]
All Tables
All Figures
|
Fig. 1 Formation of Galactic GCs with multiple stellar populations in a very gas-rich dwarf at high z. The entire formation process is divided into six steps. STEP 1: formation of massive clumps consisting of gas and new stars in verygas-rich massive dwarf disk galaxies. STEP 2: formation of massive FG systems from merging stellar clumps and filaments developed in these clumps. STEP 3: formation of SG stars from AGB ejecta mixed with pristine ISM in forming FG systems. STEP 4: almost complete destruction of FG stellar systems by the tidal field of GC-host dwarfs. STEP 5: accretion of GC host dwarfs onto the halo region of the Galaxy in the early formation history of the Galaxy. STEP 6: destruction of GC host dwarfs by the strong tidal field of the Galaxy. |
| In the text | |
|
Fig. 2 Initial contributions of dark matter, old stars, and gas to the rotation curve of a gas-rich dwarf at T = 0 Myr and the gas distribution projected onto the x–y plane at T =56 Myr in the standard model (M1). |
| In the text | |
|
Fig. 3 Time evolution of stellar distributions projected onto the x–y (left panel) plane in the standard model. Clearly, several massive high-density clumps of FG stars, where SG stars are forming, can be formed within 0.3 Gyr. |
| In the text | |
|
Fig. 4 Time evolution of mass distributions projected onto the x–y plane for ISM (blue), FG stars (magenta), AGB ejecta (green), and SG stars (cyan) of GC1 in the standard model (M1). The upper and lower eight panels are for larger and smaller scales of view, respectively. The time T in the upper left corner of each panel shows the time (in units of Myr) that has elapsed since the simulation stars. The thick bar indicates 100 pc and 10 pc for upper and lower eight panels, respectively. The mass-center of GC1 is the center of each frame in this figure. |
| In the text | |
|
Fig. 5 Time evolution of total mass within 20 pc (top panel) and 50pc (middle panel) for FG (red solid), SG (blue dotted), and AGB (green dashed) stars for GC1 in the standard model. Bottom panel: mean SF rate at selected time steps for FG (red solid) and SG (blue dotted) |
| In the text | |
|
Fig. 6 Distributions of FG (red) and SG (blue) stars projected onto the x–z plane (upper panel) and the line-of-sight velocity profile (Vlos) for FG (solid) and SG (dotted) stars (lower panel) for GC1 in the standard model. |
| In the text | |
|
Fig. 7 Projected radial density profiles (Σs) of FG (red solid) and SG (blue dotted) stars for GC1 (top panel), GC2 (middle panel), and GC4 (bottom panel) in the standard model. |
| In the text | |
|
Fig. 8 Dependencies of MSG and fSG on MFG for GC candidates in four models: the standard model M1 (upper left panel), M2 with strong SG feedback effects (upper right panel), M3 with no SN feedback effects (lower left panel), and M4 with no AGB feedback effects (lower right panel). |
| In the text | |
|
Fig. 9 As in Fig. 8 but for GC candidates in four models with different fg (and fb): M5 (upper left panel), M6 (upper right panel), M7 (lower left panel), and M8 (lower right panel). Other model parameters for these four models are the same as those in the standard model. |
| In the text | |
|
Fig. 10 Asin Fig. 8 but for GC candidates in four models with different Σg (i.e., initial mean gas surface density): M9 (upper left panel), M10 (upper right panel), M11 (lower left panel), and M12 (lower right panel). The initial stellar mass is the same (108 M⊙) between the four models, whereas the initial gas mass is different for different Σg. Other model parameters for these four models are the same as those in the standard model. |
| In the text | |
|
Fig. 11 Asin Fig. 8 but for GC candidates in four models with different Mdm: M16 (upper left panel), M17 (upper right panel), M1 (lower left panel), and M18 (lower right panel). fg and fb are the same between these four models. |
| In the text | |
|
Fig. 12 Asin Fig. 8 but for GC candidates in four models with different Σs (initial mean stellar surface density): M13 (upper left panel), M14 (upper right panel), M1 (lower left panel), and M15 (lower right panel). fg and fb are the same between these four models. |
| In the text | |
|
Fig. 13 Distributions of FG (red) and SG (blue) stars projected onto the x–y plane for eight selected GCs. The model number and GC ID are given in the upper right corner for each panel. For example, “M15-GC4” means that this GC is GC4 in the model M15. The thick bar in the lower left corner for each panel indicates a size of 10 pc. The three GCs with green circles (M15-GC4, M2-GC1, and M6-GC2) are binary GCs with smaller companions, and the location of a companion GC is shown by a green circle. |
| In the text | |
|
Fig. 14 Same as Fig. 7 but for GC1 and GC2 in the model M18. These GCs formed in a more massive dwarf are more massive and have higher central densities than those in the standard model. |
| In the text | |
|
Fig. 15 GC candidates with MGC ≥ 2 × 10⁶ M⊙ on the ρSG−MSG plane, whereρSG is the mean mass density of SG stars in an originally massive GC candidate at its half-mass radius (Reff) of SG stars. All SG stars within 57 pc from the center of a GC candidate are used to estimate Reff for SG stars of the GC. These GC candidates are formed in the models with Mdm = 2 × 10¹⁰ M⊙. |
| In the text | |
|
Fig. 16 Dependencies of mean [Fe/H] ([Fe/H]m; upper panel)and internal [Fe/H] spread (σ[Fe/H]; lower panel) among GC stars on MSG in the seven GC candidates of the standard model for α = −0.02 (filled circles) and α = −0.04 (open circles), where α is the slope of an initial metallicity gradient (dex kpc−1). |
| In the text | |
Current usage metrics show cumulative count of Article Views (full-text article views including HTML views, PDF and ePub downloads, according to the available data) and Abstracts Views on Vision4Press platform.
Data correspond to usage on the plateform after 2015. The current usage metrics is available 48-96 hours after online publication and is updated daily on week days.
Initial download of the metrics may take a while.