Fig. 4
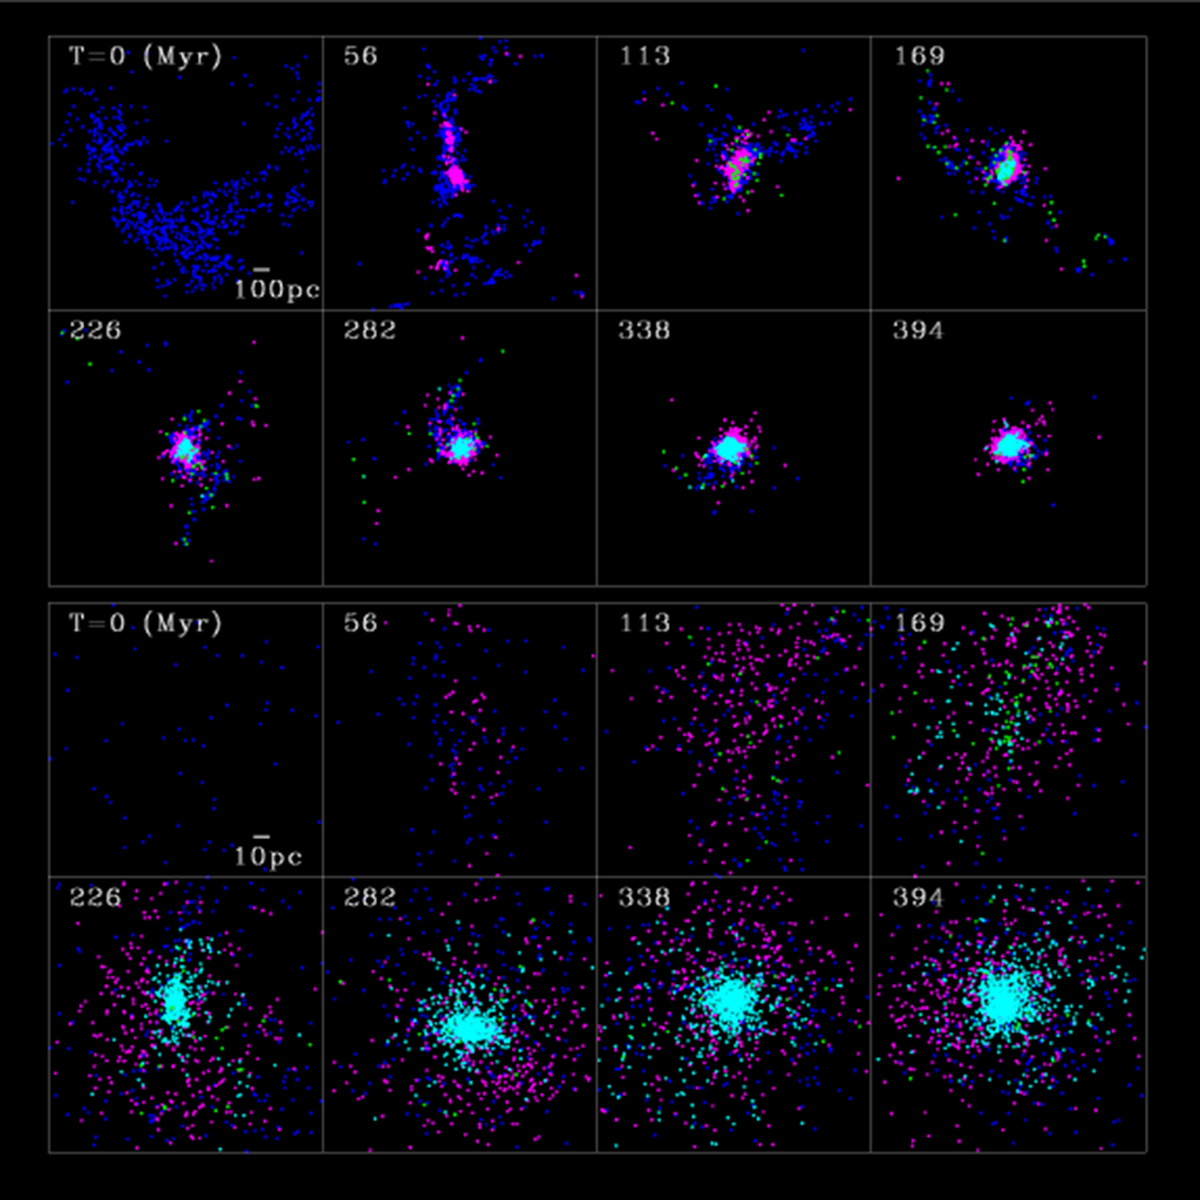
Time evolution of mass distributions projected onto the x–y plane for ISM (blue), FG stars (magenta), AGB ejecta (green), and SG stars (cyan) of GC1 in the standard model (M1). The upper and lower eight panels are for larger and smaller scales of view, respectively. The time T in the upper left corner of each panel shows the time (in units of Myr) that has elapsed since the simulation stars. The thick bar indicates 100 pc and 10 pc for upper and lower eight panels, respectively. The mass-center of GC1 is the center of each frame in this figure.
Current usage metrics show cumulative count of Article Views (full-text article views including HTML views, PDF and ePub downloads, according to the available data) and Abstracts Views on Vision4Press platform.
Data correspond to usage on the plateform after 2015. The current usage metrics is available 48-96 hours after online publication and is updated daily on week days.
Initial download of the metrics may take a while.