| Issue |
A&A
Volume 621, January 2019
|
|
|---|---|---|
| Article Number | L9 | |
| Number of page(s) | 6 | |
| Section | Letters to the Editor | |
| DOI | https://doi.org/10.1051/0004-6361/201834545 | |
| Published online | 14 January 2019 | |
Letter to the Editor
Face changing companion of the redback millisecond pulsar PSR J1048+2339
1
Institute of Astronomy, National Tsing Hua University, Hsinchu 30013, Taiwan
e-mail: yapyeexuan@gapp.nthu.edu.tw
2
Department of Physics, UNIST, Ulsan 44919, Korea
3
School of Physics, Huazhong University of Science and Technology, Wuhan 430074, PR China
4
Department of Space Science and Geology, Chungnam National University, Daejeon, Republic of Korea
5
Department of Astronomy and Space Science, Chungnam National University, Daejeon, Republic of Korea
Received:
31
October
2018
Accepted:
20
December
2018
We present optical observations of the redback millisecond pulsar PSR J1048+2339, which is a 4.66 ms radio pulsar in a compact binary with an orbital period of six hours. We obtained high-quality light curves of PSR J1048+2339 with the Lulin 1 m Telescope. The system shows two distinct six-hour orbital modulations, in which an ellipsoidal modulation changes into a sinusoidal-like profile in less than 14 days. In addition to the change, the brightness of the companion increased by one magnitude, suggesting that the latter type of modulation is caused by the pulsar wind heating of the companion and that the heating became dominant in the system. While the changes are not unexpected, such a timescale is the shortest among similar systems. We performed modeling analysis to extract the properties of the system. We obtained a derived pulsar mass of 2.1 M⊙ and a companion star mass of 0.4 M⊙ for the system. The irradiation power increased by a factor of 6 during which the pulsar wind heating dominates. We also report on the two archival Chandra X-ray observations and discuss several possibilities that might cause the varying heating on the companion.
Key words: pulsars: individual: PSR J1048+2339 / X-rays: binaries
© ESO 2019
1. Introduction
PSR J1048+2339 (hereafter J1048+2339) is a 4.66 ms millisecond pulsar that was discovered by Cromartie et al. (2016) using Arecibo Observatory. It was later confirmed as a redback system by Deneva et al. (2016) with multiwavelength observations. The system has an orbital period of six hours and spin-down power  erg s−1. This object is more than just a radio pulsar; it has a gamma-ray counterpart, which is 3FGL J1048.6+2338 in the Fermi Large Area Telescope (LAT) four-year point source catalog (3FGL; Acero et al. 2015). J1048.6+2338 was originally associated with a BL Lac active galactic nuclei (AGN; NVSS J104900+233821) in 3FGL, however the improved localization in the recent preliminary LAT eight-year source list (FL8Y)blue1 ruled out the possibility that it is an AGN. In a previous optical study with the Catalina Real-Time Transient Survey (CRTS), Palomar Transient Factory (PTF), Sloan Digital Sky Survey (SDSS), and Pan-STARSS survey data, the light curves indicated intrinsic variability in the system. While there are no significant X-ray (the Neil GehrelsSwift-XRT) and gamma-ray (Fermi-LAT) pulsations detected, Deneva et al. (2016) proposed that J1048+2339 has a minimum mass of 0.3 M⊙ and effective temperature Teff of 3350 K, with assumptions of a 1.4 M⊙ mass neutron star and an inclination of 90°. In this Letter, we present the optical observations of J1048+2339 taken in 2018 March and April, in which the orbital modulation changes from ellipsoidal to pulsar wind heating in less than 14 days. We also include light curve modeling to constrain the geometry of the binary and an independent X-ray analysis based on the two archival Chandra observations.
2. Observations and data analysis
2.1. Optical observations
We observed J1048+2339 with the Lulin 1 m telescope (LOT) on six separate nights from 2018 March 11 to April 23. Each image is exposed for 300 s and alternated between SDSS r′ and g′ filters. These raw images are then processed with IRAF V2.15 with standard calibration procedures, including bias and flat-field corrections. In addition, we have data from the 2 m Liverpool Telescope (LT; Steele et al. 2004) taken in late March, which were flat- and bias-corrected. The r′ and g′ filters are alternated with 180 s exposure time, except for the g′ band data taken on 2018 March 25 and 26, which were exposed for 300 s per image. In total, there are 189 images (15.23 h total integration time) with the r′ filter, and 147 images (12.07 h total integration time) with g′ filter. A summary of all observations is recorded in Table 1. We obtained the magnitude information by performing differential photometry to the reduced images with the IRAF package phot. We used ten isolated and nonsaturated stars to compute the relative magnitudes for J1048+2330. The relative magnitudes were then converted to apparent magnitudes using a nearby star SDSS J104840.81+234018.0 of which the magnitudes in the r′ band and g′ band are 16.53 and 17.90, respectively. We folded the light curves using the orbital period of 0.250519045 d and ascending node T0 = MJD 56637.598177 from the radio ephemeris (Deneva et al. 2016). The folded light curves are presented in Fig. 1. The quantity ϕ = 0 corresponds to the ascending node of pulsar.
Summary of observations.
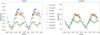 |
Fig. 1. Light curves of PSR J1048+2339 companion star with the SDSS r′ and g′ band filter between 2018 March 11 and April 23, folded with an orbital period of 6 h and T0 = MJD 56637.598177. While the pulsar wind heating and ellipsoidal variation are clearly seen in both bands, the magnitude in the g′ band has larger variation compared to that of the r′ band. An orbital phase of 0.25 corresponds to the inferior conjunction of the companion star. |
2.2. Face changing companion
We observed a pronounced six-hour modulation in the first two nights of observation (2018 March 11 and 12). We detected two minima at ϕ = 0.25 and ϕ = 0.75, and two maxima at ϕ = 0.55 and ϕ = 0, which resemble an ellipsoidal modulation of the companion star. Ellipsoidal modulation is a consequence of the orbital motion for a tidally distorted star, which is commonly seen among redback systems (e.g., PSR J2129−0429; Hui et al. 2015; Bellm et al. 2016). In Fig. 1, we see that the minima at ϕ = 0.25 is deeper than ϕ = 0.75 by ∼0.1 mag.
Subsequent observing runs with LT were carried out from 2018 March 24–26. On March 24, we observed an increase of 0.3 mag (compared to the previous data taken at the same phase) at ϕ = 0.55 in r′ band. Similar changes are also observed in the g′ band. On March 25, data points were taken close to the companion inferior conjunction (ϕ = 0.25), and they agree well with the minimum seen in other observations. On March 26, the r′ magnitude at ϕ = 0.09 increased by 1 mag (compared to the previous data taken at the same phase) and then decreased quickly by 1.1 mag at ϕ = 0.21, whereas the corresponding g′ magnitude, which was taken slightly earlier, increased instead. To make sure there was no random error involved, we plot J1048+2339 against one of the comparison stars to compare their light curves (cf. Fig. 2). The light curve of the comparison star is relatively stable, indicating the observed variation in the companion is likely genuine. This might be because of a spontaneous flaring event of some kind of transition that arose in late March.
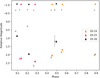 |
Fig. 2. Close examination of PSR J1048+2339 companion in late March 2018. The light curve of the companion star (triangle) and a nearby comparison star (circle) are plotted to confirm the magnitude decrease/increase at ϕ = 0.21 observed in the g′ (gray) and r′ (colored) band. The comparison star is relatively stable, indicating the observed variation at ϕ = 0.21 in J1048+2339 companion is likely genuine. |
J1048+2339 was observed again in early April with LOT. As shown in Fig. 1, the folded light curves have a minimum at ϕ = 0.25 and a maximum at ϕ = 0.65, which are very different compared to the March light curves. The April light curves resemble pulsar wind heating. As discussed in Romani & Sanchez (2016), a direct pulsar irradiation toward the companion star would be expected to give a peak at ϕ = 0.75, but intrabinary shock can accounted for the peak observed slightly before 0.75. Heating from the intrabinary shock was also discussed in Takata et al. (2014) and Li et al. (2014). From our observations, the pulsar heating effect at ϕ = 0.75 was affected by the minimum in the ellipsoidal modulation. The trace of ellipsoidal modulation can still be seen even when pulsar heating becomes dominant. That implies that the flux produced from the irradiated companion takes on a considerable proportion of the total flux detected. In addition, the g′ band light curve has larger variation than that of the r′ band light curve, indicating a larger temperature variation. The distinct changes from March to April light curves suggest that a face changing mechanism took place in less than two weeks. The heating effect in J1048+2339 was evident up until our observation in late April.
2.3. Chandra observation
We also explored the X-ray properties of J1048+2339 with two archival Chandra data, which were taken on 2017-03-08 (obsID 19039; 22.6 ks) and 2017-07-04 (obsID 19038; 24.7 ks). In both observation, J1048+2339 was imaged with the back-illuminated CCD ACIS-S3. The data were reprocessed using standard Chandra Interative Analysis of Observations (CIAO) software and updated Chandra Calibration Database (CALDB). All the subsequent analysis are restricted in 0.3–8 keV energy range.
An X-ray point source is clearly detected at the pulsar position with no hint of any extended X-ray emission. The phase-averaged spectrum were extracted from a 3 arcsec source region. The background spectra were sampled from a nearby source-free region in each observation. After background subtraction, we obtained 91 and 122 net counts for the respective observations. For each spectrum, we binned the data to have at least 10 counts per spectral bin. This led to an approximately Gaussian distribution of the binned data so that we can adopt chi-square as the fit statistic. We then performed spectral analysis using the absorbed power-law model. We found that the best-fit spectral parameters and fluxes deduced from both observations are consistent within the tolerance of the statistical uncertainties. Therefore, we fitted both spectra simultaneously in order to maximize the photon statistics and obtain tighter constraints for the spectral parameters.
As the column absorption NH cannot be constrained properly, we fixed it at the total Galactic HI column density, NH = 2.3 × 1020 cm−2, in the direction of J1048+2339 (Kalberla et al. 2005). The best-fit with a power-law yield a photon index of Γ = 1.64 ± 0.15 (c.f. Fig. 3) and a goodness-of-fit of χ2 = 7.64 for 17 d.o.f. The photon index is similar to the typical value of redbacks (Lee et al. 2018). The unabsorbed X-ray flux in 0.3–8 keV is  erg s−1 cm−2. At a distance of 852 pc as estimated by Gaia (Bailer-Jones et al. 2018), the 0.3–8 keV X-ray luminosity is
  erg s−1. We also considered a pure thermal scenario by fitting the spectra with an absorbed blackbody model. However, the goodness-of-fit is found to be undesirable (χ2 = 28.7 for 17 d.o.f.).
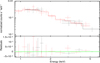 |
Fig. 3. X-ray spectra of PSR J1048+2339 obtained from both Chandra observations (ObsIDs: 19038 and 19039) with the best-fit absorbed power-law model (top panel) and the fitting residuals (bottom panel). |
After barycentering the arrival times in both observations, we folded the data from each observation at the same orbital period and T0 defined previously for the optical light curves. We did not identify any significant differences between the two observations. In the top panel of Fig. 4, we show the orbital modulation of J1048+2339 in 0.3–8 keV by combining the data from these two observations. The X-ray emission is found to attain the peak just before the companion enters the superior conjunction (ϕ = 0.75). We also examined if there is any differences in the modulation in the soft band (0.3–2 keV) and hard band (2–8 keV) (cf. middle panel of Fig. 4). However, there is no significant variation of X-ray hardness can be found (cf. bottom panel of Fig. 4).
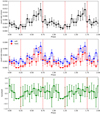 |
Fig. 4. Top panel: X-ray orbital modulation of PSR J1048+2339 in 0.3–8 keV with both Chandra observation combined. The phase zero is at same epoch as that in Fig. 1. The time bin size is about 2000 s. The red vertical lines illustrate the locations of inferior conjunction (ϕ = 0.25) and superior conjunction (ϕ = 0.75) of the companion. Middle panel: blue solid and red dashed lines illustrate the orbital modulation in soft band (0.3–2 keV) and hard band (2–8 keV), respectively. Bottom panel: variation of X-ray hardness across the orbit. |
3. Optical light curve modeling
We use the eclipsing light curve code (ELC) by Orosz & Hauschildt (2000) to generate light curve models for two groups of data according to their modulation. We combined 2018 March 11 and 12 light curves (ellipsoidal modulation) into one group (group 1) and 2018 April 2 and 3 light curves (pulsar heating modulation) into another (group 2). We save computing time by doing so and most importantly, this grouping is adequate for exploring the heating effect seen from the two distinct groups that are three weeks apart. In the modeling analysis, we assumed the following: convective envelopes for both stars, a nonspherical shape of the companion, absence of an accretion disk, and point source X-ray heating. Owing to the difficulty in measuring the spot locations, no spots are added to the models, although it can be accounted for the different maximum observed at the ascending and descending node of the ellipsoidal-modulated light curve. We also supply a SDSS atmosphere model to the ELC. We use the optimisers provided in the ELC to fit the folded g′ and r′ band light curves simultaneously; the parameters are listed in Table 2. We first use GridELC to search around the initial guess, by performing a “grid search” with the assigned grid size, until a minimum χ2 is obtained. We then use differential evolution Monte Carlo Markov chain (demcmcELC) to explore the probability of these fitted parameters. Each fit evolved over 2000 generations with 50 members in the population.
ELC modeling results.
Initial fitting results inferred that the companion fully filled its Roche lobe (f1 = 0.99), but other parameters were not well constrained. We tried fixing f1 = 1 and the results are shown in Fig. A.1 (top panels). For instance, the pulsar irradiation in Group 2 increased by a factor of 19, compared to that of Group 1. The fitted inclinations are 40°–60° while the effective temperatures (corresponding to the night side temperature of the star) are around 4000 K. The mass ratio in both groups are unconstrained but both have a median around 4.4–5.5. We attribute this scenario to the lack of radial velocity measurements. At the fitted inclinations, the mass ratios imply a pulsar mass of around 3 M⊙, which is too massive for a neutron star. For a typical pulsar, the above mass ratios inferred a higher inclination. Furthermore, the difference in the pulsar irradiation is too large to be justified. In the subsequent analysis, we fixed the inclination to a theoretical upper limit of 76° for which an X-ray eclipse was not observed, using the derived pulsar mass of 2.1 M⊙ and a companion star mass of 0.4 M⊙, obtained from the light curve fitting. The results are shown in Fig. A.1 (bottom panels), in addition to Table 2. We obtained a factor of ∼6 increment in the Group 2 pulsar irradiation, in comparison to the irradiation in Group 1. The filling factors and effective temperatures are ∼0.8 and ∼4200 K in both groups.
4. Discussion
We observed a face changing companion of the redback system J1048+2339, in which the modulation changes evidently from ellipsoidal to pulsar heating. The changing timescale took no more than 14 days. It is not clear if the timescale of ≤14 days is only exclusive to J1048+2339. Based on our LT data, the unusual brightening at ϕ = 0.21 might be a precursor of a huge flaring taking place in the system. More recently, Cho et al. (2018) reported an optical brightening and an X-ray flaring event of the system. The optical emission at orbital phase ϕ = 0.75 increased by 0.5 mag on 2018 April 18 (compared to their previous detection) and went back to quiescence (R ≳ 20.5 mag) in the 2018 May 20 observation. An X-ray flare was detected by Chandra on 2018 July 8 at ϕ = 0.9. By comparing with our observations, it follows that the pulsar wind heating timescale is at most ∼2 months.
The observed brightening of the companion star and the X-ray modulation provide us the information of the heating source for the companion star. From the observed and estimated properties of the system, the separation of the two stars, a, and the Roche-lobe radius, Rrb, of the companion star are estimated as a = 1.5 × 1011 cm and Rrb/a = 0.25. With the ELC model, we find the required irradiation luminosity of Lirr ∼ 1033 − 34 erg s−1 (cf. Table 2), if we assume the heating source is located at the position of the pulsar. In this case, a fraction of the luminosity absorbed by the companion star would be estimated by  . Hence, we may estimate the rate of the energy absorbed by the companion star as Lab ∼ δLirr ∼ 5 × 1031 erg s−1(δ/0.016)(Lirr/1033.5 erg s−1).
There are several possibilities for the sources of the heating: the pulsar wind (Harding & Gaisser 1990), gamma-ray radiation from the pulsar (Takata et al. 2012), and the intrabinary shock emission (Sanchez & Romani 2017). For J1048+2339, the gamma-rays from the magnetosphere, for which the luminosity is usually 10% of the spin-down power, are not the main heating source, since the magnetospheric emission are steady and cannot explain the observed brightening (∼1 mag) of the companion star. The change of the gamma-ray emission from the pulsar magnetosphere has been observed for young pulsar PSR J2021+4026 (Zhao et al. 2017). However, such a flux change is accompanied by a large glitch of the neutron star. For millisecond pulsars, such a large glitch has not been observed yet.
The observed X-ray luminosity from the intrabinary shock of this system is on the order of LX ∼ 1031 erg s−1, which is comparable to the required energy of the absorption Lab. Hence if the shock emission is the main heating source, the intrabinary shock should be located near/on the companion star source. In such a case, a natural explanation of the observed X-ray modulation with the flux peak around the superior conjunction is a consequence of the obstruction of the X-ray emitting region by the companion star. As demonstrated in Bogdanov et al. (2011), however, the modulation expected by this scenario has a sinusoidal shape and the expected width of the peak (≥0.5 orbital phase) is wider than the observed one peak (say, ∼0.3). This scenario would also be difficult to explain the observed large amplitude (factor of 10, cf. Fig. 4), unless our view is almost edge-on. In fact, our results imply a high inclination of the system, consistent with the recent work by Strader et al. (2018) in which a near to edge-on orbit for J1048+2339 is suggested using radial velocity measurements.
Alternatively, the X-ray peak can be interpreted as the Doppler boosting effect of the pulsar wind flow (see Huang et al. 2012). In this scenario, the pressure of the stellar wind is stronger than the pulsar wind pressure and the shock cone wraps the pulsar. The Doppler boosting effect enhances (or weakens) the observed X-ray flux when the pulsar wind moves toward (or away from) the Earth. PSR J2129-0429, for example, shows a double peak structure at a small dip at the superior conjunction (Kong et al. 2018). It has been suggested that since the spin of the companion is synchronized with the orbital period, the stellar magnetic field of the companion star is enhanced to several kilogauss (kG) by the stellar dynamo process (Sanchez & Romani 2017). The X-ray peak (cf. Fig. 4) is not symmetric. Depending on the inclination angle of the binary, a double peak can be produced if the viewing angle is within the shock cone, while single peak is expected if the viewing angle is outside the shock cone.
If the intrabinary shock is located far from the companion star surface and wraps the pulsar, the observed X-ray luminosity, LX ∼ 1031 erg s−1, is insufficient to explain the heating of the companion star. To overcome this difficulty, Sanchez & Romani (2017) proposed that a portion of pulsar wind particles duct along the magnetic field of the companion star to the companion star surface, although it is uncertain how a fraction of the pulsar wind particles can cross the contact discontinuity of the MHD shock (Wadiasingh et al. 2017). If we assume that the pulsar wind particles carry an energy of LPW ∼ Lsd = 1.2 × 1034 erg s−1 and assume that several percent of the wind energy, which is required to explain the observed X-ray luminosity for J1048+2239, is stopped by the intrabinary shock, a several percent of the shocked pulsar wind particles will reach the companion star surface. The pairs trapped by the magnetic field of the companion star will increase their pitch angle and lose their energy via synchrotron radiation as they move toward the stellar surface. This radiation could be one of the sources of the heating. Since the pairs with a large pitch angle cannot reach the star surface owing to the magnetic mirror, only pairs with small pitch angle can deposit on and directly heat up the companion surface.
Light curve modeling shows that the heating energy increased by a factor of 6 in less than three weeks. We speculate that this is related to the activity of the companion star, and the magnetic field of the companion star could play an important role by connecting to the shock region and guides the pair plasmas to the companion star surface. For instance, after 2018 March 12, more pair plasmas are guided to the companion star. In the event that the magnetic field of the companion star is suddenly weakened, the location of the intrabinary shock moves toward the companion star surface, and increases the heating energy in late March. Interestingly, there is a spontaneous flaring event on 2018 March 26 before the launch of the pulsar heating modulation and the color variation suggests that the flare emission is hot. It is likely due to some heating effect related to magnetic activity on the tidally locked companion instead of reprocessing. Future multicolor monitoring will allow us to investigate the face changing mechanism of this intriguing redback system.
Another speculative scenario is that the outflow from an unaccreting dead disk stops the pulsar wind located close to the pulsar (D’Angelo & Spruit 2010; Takata et al. 2012). In this scenario, the irradiated gamma rays on the disk are absorbed by the disk, if the column density is greater than a critical value of σ ∼ 60 h/l g cm−2, where h and l is the thickness of the disk and propagating length of the gamma rays in the disk. The absorbed energy will be converted into the outflow from the disk, which could block the pulsar wind near the pulsar. After 2018 March 12, the disk column density could be lower than the critical value, and no formation of the outflow from the disk, therefore allowing the intrabinary shock to move toward the companion star and thus increase the heating.
Acknowledgments
We thank K. S. Cheng for helpful discussions. This work has made use of data collected at Lulin Observatory, partly supported by the Ministry of Science and Technology of the Republic of China (Taiwan) through grant 105-2112-M-008-024-MY3. The scientific results reported in this article are based on data obtained from the Chandra Data Archive. The Liverpool Telescope is operated on the island of La Palma by Liverpool John Moores University in the Spanish Observatorio del Roque de los Muchachos of the Instituto de Astrofisica de Canarias with financial support from the UK Science and Technology Facilities Council. Y.X.Y and A.K.H.K. are supported by the Ministry of Science and Technology of the Republic of China (Taiwan) through grants 105-2119-M-007-028-MY3 and 106-2628-M-007-005. J.T. is supported by NSFC grants of Chinese Government under 11573010, 1166116 1010, U1631103, and U1838102. J.L. is supported by BK21 plus Chungnam National University and the National Research Foundation of Korea grant 2016R1A5A1013277. C.Y.H. and K.L.L are supported by the National Research Foundation of Korea grant 2016R1A5A1013277.
References
- Acero, F., Ackermann, M., Ajello, M., et al. 2015, ApJS, 218, 23 [Google Scholar]
- Bailer-Jones, C. A. L., Rybizki, J., Fouesneau, M., Mantelet, G., & Andrae, R. 2018, AJ, 156, 58 [NASA ADS] [CrossRef] [Google Scholar]
- Bellm, E. C., Kaplan, D. L., Breton, R. P., et al. 2016, ApJ, 816, 74 [NASA ADS] [CrossRef] [Google Scholar]
- Bogdanov, S., Archibald, A. M., Hessels, J. W. T., et al. 2011, ApJ, 742, 97 [NASA ADS] [CrossRef] [Google Scholar]
- Cho, P. B., Halpern, J. P., & Bogdanov, S. 2018, ApJ, 866, 71 [NASA ADS] [CrossRef] [Google Scholar]
- Cromartie, H. T., Camilo, F., Kerr, M., et al. 2016, ApJ, 819, 34 [Google Scholar]
- D’Angelo, C. R., & Spruit, H. C. 2010, MNRAS, 406, 1208 [NASA ADS] [Google Scholar]
- Deneva, J. S., Ray, P. S., Camilo, F., et al. 2016, ApJ, 823, 105 [NASA ADS] [CrossRef] [Google Scholar]
- Harding, A. K., & Gaisser, T. K. 1990, ApJ, 358, 561 [NASA ADS] [CrossRef] [Google Scholar]
- Huang, R. H. H., Kong, A. K. H., Takata, J., et al. 2012, ApJ, 760, 92 [NASA ADS] [CrossRef] [Google Scholar]
- Hui, C. Y., Hu, C. P., Park, S. M., et al. 2015, ApJ, 801, L27 [NASA ADS] [CrossRef] [Google Scholar]
- Kalberla, P. M. W., Burton, W. B., Hartmann, D., et al. 2005, A&A, 440, 775 [NASA ADS] [CrossRef] [EDP Sciences] [Google Scholar]
- Kong, A. K. H., Takata, J., Hui, C. Y., et al. 2018, MNRAS, 478, 3987 [NASA ADS] [CrossRef] [Google Scholar]
- Lee, J., Hui, C. Y., Takata, J., et al. 2018, ApJ, 864, 23 [NASA ADS] [CrossRef] [Google Scholar]
- Li, K. L., Kong, A. K. H., Takata, J., et al. 2014, ApJ, 797, 111 [NASA ADS] [CrossRef] [Google Scholar]
- Orosz, J. A., & Hauschildt, P. H. 2000, A&A, 364, 265 [NASA ADS] [Google Scholar]
- Romani, R. W., & Sanchez, N. 2016, ApJ, 828, 7 [NASA ADS] [CrossRef] [Google Scholar]
- Sanchez, N., & Romani, R. W. 2017, ApJ, 845, 42 [NASA ADS] [CrossRef] [Google Scholar]
- Steele, I. A., Smith, R. J., Rees, P. C., et al. 2004, in Ground-based Telescopes, ed. J. M. Oschmann, Jr., Proc. SPIE, 5489, 679 [CrossRef] [Google Scholar]
- Strader, J., Swihart, S. J., Chomiuk, L., et al. 2018, ApJ, submitted [arXiv:1812.04626] [Google Scholar]
- Takata, J., Cheng, K. S., & Taam, R. E. 2012, ApJ, 745, 100 [NASA ADS] [CrossRef] [Google Scholar]
- Takata, J., Li, K. L., Leung, G. C. K., et al. 2014, ApJ, 785, 131 [NASA ADS] [CrossRef] [Google Scholar]
- Wadiasingh, Z., Harding, A. K., Venter, C., Böttcher, M., & Baring, M. G. 2017, ApJ, 839, 80 [NASA ADS] [CrossRef] [PubMed] [Google Scholar]
- Zhao, J., Ng, C. W., Lin, L. C. C., et al. 2017, ApJ, 842, 53 [NASA ADS] [CrossRef] [Google Scholar]
Appendix A: Additional figure
 |
Fig. A.1. Corner plot of the fitted parameters: luminosity Lx, filling factor f1, mass ratio q, and effective temperature Teff. Top left: Roche-lobe filling factor of 1 is assumed in Group 1 (ellipsoidal modulation) fitting. Top right: Roche-lobe filling factor of 1 is assumed in Group 2 (pulsar heating modulation) fitting. Bottom left: inclination angle of 76° is assumed in Group 1 (ellipsoidal modulation) fitting. Bottom right: inclination angle of 76° is assumed in Group 2 (pulsar heating modulation) fitting. The best-fit parameter is displayed with 1σ confidence interval for a 2D histogram. |
All Tables
All Figures
|
Fig. 1. Light curves of PSR J1048+2339 companion star with the SDSS r′ and g′ band filter between 2018 March 11 and April 23, folded with an orbital period of 6 h and T0 = MJD 56637.598177. While the pulsar wind heating and ellipsoidal variation are clearly seen in both bands, the magnitude in the g′ band has larger variation compared to that of the r′ band. An orbital phase of 0.25 corresponds to the inferior conjunction of the companion star. |
| In the text | |
|
Fig. 2. Close examination of PSR J1048+2339 companion in late March 2018. The light curve of the companion star (triangle) and a nearby comparison star (circle) are plotted to confirm the magnitude decrease/increase at ϕ = 0.21 observed in the g′ (gray) and r′ (colored) band. The comparison star is relatively stable, indicating the observed variation at ϕ = 0.21 in J1048+2339 companion is likely genuine. |
| In the text | |
|
Fig. 3. X-ray spectra of PSR J1048+2339 obtained from both Chandra observations (ObsIDs: 19038 and 19039) with the best-fit absorbed power-law model (top panel) and the fitting residuals (bottom panel). |
| In the text | |
|
Fig. 4. Top panel: X-ray orbital modulation of PSR J1048+2339 in 0.3–8 keV with both Chandra observation combined. The phase zero is at same epoch as that in Fig. 1. The time bin size is about 2000 s. The red vertical lines illustrate the locations of inferior conjunction (ϕ = 0.25) and superior conjunction (ϕ = 0.75) of the companion. Middle panel: blue solid and red dashed lines illustrate the orbital modulation in soft band (0.3–2 keV) and hard band (2–8 keV), respectively. Bottom panel: variation of X-ray hardness across the orbit. |
| In the text | |
|
Fig. A.1. Corner plot of the fitted parameters: luminosity Lx, filling factor f1, mass ratio q, and effective temperature Teff. Top left: Roche-lobe filling factor of 1 is assumed in Group 1 (ellipsoidal modulation) fitting. Top right: Roche-lobe filling factor of 1 is assumed in Group 2 (pulsar heating modulation) fitting. Bottom left: inclination angle of 76° is assumed in Group 1 (ellipsoidal modulation) fitting. Bottom right: inclination angle of 76° is assumed in Group 2 (pulsar heating modulation) fitting. The best-fit parameter is displayed with 1σ confidence interval for a 2D histogram. |
| In the text | |
Current usage metrics show cumulative count of Article Views (full-text article views including HTML views, PDF and ePub downloads, according to the available data) and Abstracts Views on Vision4Press platform.
Data correspond to usage on the plateform after 2015. The current usage metrics is available 48-96 hours after online publication and is updated daily on week days.
Initial download of the metrics may take a while.