| Issue |
A&A
Volume 621, January 2019
|
|
|---|---|---|
| Article Number | L4 | |
| Number of page(s) | 5 | |
| Section | Letters to the Editor | |
| DOI | https://doi.org/10.1051/0004-6361/201834500 | |
| Published online | 04 January 2019 | |
Letter to the Editor
Insights on bar quenching from a multiwavelength analysis: The case of Messier 95
1
Department of Physics, Christ University, Bangalore, India
e-mail: This email address is being protected from spambots. You need JavaScript enabled to view it.
2
Indian Institute of Astrophysics, Koramangala II Block, Bangalore, India
Received:
24
October
2018
Accepted:
3
December
2018
Abstract
The physical processes related to the effect of bars in the quenching of star formation in the region between the nuclear/central sub-kiloparsec region and the ends of the bar (bar region) of spiral galaxies is not fully understood. It is hypothesized that the bar can either stabilize the gas against collapse, inhibiting star formation, or efficiently consume all the available gas, leaving no fuel for further star formation. We present a multiwavelength study using the archival data of an early-type barred spiral galaxy, Messier 95, which shows signatures of suppressed star formation in the bar region. Using optical, ultraviolet (UV), infrared, CO, and HI imaging data we study the pattern of star formation progression and stellar/gas distribution, and try to provide insights into the process responsible for the observed pattern. The FUV–NUV pixel colour map reveals a cavity devoid of UV flux in the bar region that matches the length of the bar, which is ∼4.2 kpc. The central nuclear region of the galaxy shows a blue colour clump and along the major axis of the stellar bar the colour progressively becomes redder. Based on a comparison to single stellar population models, we show that the region of galaxy along the major axis of the bar, unlike the region outside the bar, is comprised of stellar populations with ages ≥350 Myr; there is a star-forming clump in the centre of younger ages of ∼150 Myr. Interestingly the bar region is also devoid of neutral and molecular hydrogen but has an abundant molecular hydrogen present at the nuclear region of the galaxy. Our results are consistent with a picture in which the stellar bar in Messier 95 is redistributing the gas by funnelling gas inflows to nuclear region, thus making the bar region devoid of fuel for star formation.
Key words: galaxies: star formation / galaxies: evolution / galaxies: formation / ultraviolet: galaxies / galaxies: individual: Messier 95
© ESO 2019
1. Introduction
Galaxies in the local Universe follow a bimodal distribution in the optical broadband colours with the blue region mostly populated by star-forming spiral galaxies and the red region dominated by elliptical/S0 galaxies with little or no ongoing star formation (Strateva et al. 2001; Baldry et al. 2004). However there exists a fraction of elliptical galaxies in the blue region (Schawinski et al. 2009) and spiral galaxies in the red region (Masters et al. 2010). The number density of red galaxies are observed to increase from z ∼ 1, which is now understood to be at the expense of blue galaxies (Bell et al. 2004; Faber et al. 2007). Several internal and external processes have been proposed as responsible for the suppression of star formation (i.e. a process known as “quenching”), which often involves morphological transformation of spiral galaxies (see Peng et al. 2015; Man & Belli 2018 and references therein). The internal processes are AGN/stellar feedback and stellar bar action, and the external process encompass ram pressure stripping, major mergers, harassment, starvation, and strangulation. The existence of a population of passive red spiral galaxies (van den Bergh 1976; Couch et al. 1998; Dressler et al. 1999; Poggianti et al. 1999; Lee et al. 2008; Cortese & Hughes 2009; Deng et al. 2009; Masters et al. 2010 and references therein) imply that galaxies can transform from the star-forming to non-star-forming phase without invoking morphological transformation (Fraser-McKelvie et al. 2016). Red spiral galaxies are found to have a higher optical bar fraction than blue spiral galaxies, which highlights the importance of stellar bars in quenching star formation (Masters et al. 2010, 2011).
Stellar bars redistribute the disc content of galaxies via torques and can drive the secular evolution in spiral galaxies (Combes & Sanders 1981; Combes et al. 1990; Debattista et al. 2004; Kormendy & Kennicutt 2004 and references therein). This is possible through the inflow of gas from the outer disc to the central region, which results in an enhanced nuclear/central star formation observed in barred spiral galaxies (Athanassoula 1992; Ho et al. 1997; Sheth et al. 2005; Coelho & Gadotti 2011; Ellison et al. 2011; Oh et al. 2012). However, apart from the enhancement of star formation at the central regions the stellar bars can also suppress star formation (bar quenching) and is discussed in recent literature based on simulations and observations (Masters et al. 2010, 2012; Cheung et al. 2013; Gavazzi et al. 2015; Hakobyan et al. 2016; James & Percival 2016, 2018; Spinoso et al. 2017; Khoperskov et al. 2018). The stellar bar in massive star-forming galaxies is understood to play a dominant role in regulating the red-shift evolution of specific star formation rates and mass dependent star formation quenching in field galaxies (Gavazzi et al. 2015). The likelihood for disc galaxies to host a stellar bar is observed to be anti-correlated with specific star formation rate regardless of stellar mass and the prominence of bulge (Cheung et al. 2013). Barred galaxies are also shown to have lower star formation activity relative to unbarred galaxies (Consolandi et al. 2017, Kim et al. 2017). Barred galaxies are found to be devoid of Hα flux in the radial range covered by the bar region, suggesting no ongoing or recent star formation (James et al. 2009).
However the physical processes responsible for bar quenching are not well understood. There are primarily two mechanisms suggested for the quenching of star formation because of the effect of bars. During its formation the bar collects most of the gas inside the co-rotation radius. Then the bar-induced shocks and shear can stabilize the gas against collapse by increasing turbulence and hence inhibit star formation (Tubbs 1982; Reynaud & Downes 1998; Verley et al. 2007; Haywood et al. 2016; Khoperskov et al. 2018). An alternate mechanism is that the bar-induced torque drives gas inflows that enhance the nuclear star formation and making the region close to the bar devoid of fuel for further star formation (Combes & Gerin 1985; Spinoso et al. 2017). It is not certain whether one of these processes or a different unknown mechanism is responsible for star formation quenching in the region between the nuclear/central sub-kiloparsec region and the ends of the bar of barred spiral galaxies. In the scenario of the suppression of star formation by the stabilization of the disc due to bar-induced torques, the gas from the bar region of the galaxy does not need to be redistributed or depleted. Thus the presence/absence of gas in the bar region can put strong constraints on identifying the mechanism responsible for bar quenching in this galaxy. In this context we present a multiwavelength study based on the archival data of a barred spiral galaxy, Messier 95 (M 95).
M 951 (also known as NGC 3351) is a nearby (10 ± 0.4 Mpc; Freedman et al. 2001) early-type barred spiral galaxy (Morphology; SBb). The angular scale of 1″ corresponds to 48 pc at the distance of the galaxy. M 95 has stellar mass, HI mass, H2 mass, and integrated star formation rate of ∼1010.4 M⊙, ∼109.2 M⊙, ∼109 M⊙, and ∼0.940 M⊙ yr−1, respectively (Leroy et al. 2008). The gas phase metallicity (12 + Log O/H) of M 95 is 8.60 (Rémy-Ruyer et al. 2014). It is a nearly face-on galaxy (inclination = 41°, position angle = 192°) with a prominent bar (see Fig. 1). High quality multiwavelength data of M 95, ranging from radio to ultraviolet (UV), are available. This galaxy shows nuclear star formation and hosts a star-forming circumnuclear ring with a diameter of ∼0.7 kpc. This sub-kiloparsec-scale star formation is well studied in X-rays (Swartz et al. 2006), UV (Ma et al. 2018; Colina et al. 1997), Hα (Planesas et al. 1997; Bresolin & Kennicutt 2002), and near-infrared (Elmegreen et al. 1997). In a multiwavelength study, from UV to mid-infrared, of the nuclear ring of M 95, Ma et al. (2018) presented the integrated properties of the ring and their correlation with bar strength. Mazzalay et al. (2013) presented the properties of molecular gas within ∼300 pc of this galaxy using near-infrared integral field spectrograph, SINFONI on the Very Large Telescope, and suggested that the nuclear region hosts a stellar population of a few millionyears. Hα imaging of larger area of M 95 shows that the bar region is devoid of emission (James et al. 2009). The stellar population studies of this region indicate that they host an old population (James & Percival 2016). Long-slit spectroscopy of the bar region showed a diffused emission that is not found to be associated with star formation. These authors attribute this emission to be due to post asymptotic giant branch (p-AGB) stars (James & Percival 2015). These studies have suggested that the observed nuclear starburst and suppression of recent star formation (∼10 Myr) in the bar region is from the effect of the bar. However, the physical mechanism responsible for this observation is not understood. All the above points make this galaxy an excellent candidate to study the effect of the bar on quenching star formation. Throughout this paper, we adopt a flat Universe cosmology with Ho = 71 km s−1 Mpc−1, ΩM = 0.27, ΩΛ = 0.73 (Komatsu et al. 2011).
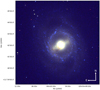 |
Fig. 1. Colour composite created from SDSS urz filter passband images of M 95. The RGB image is created by assigning red (z−band), green (r−band), and blue (u−band) colours to the filter pass band images. The dust lane along the bar is seen in the colour-composite image. |
2. Data and analysis
In this study we exploit the archival data of M 95 observed from UV to radio wavelengths as part of different campaigns. We used the SDSS urz DR9 (Ahn et al. 2012) optical imaging data of M 95 to construct a colour-composite image shown in Fig. 1 and to demonstrate the presence of a prominent stellar bar. The choice of blue (u) and red (z) passband images helps to better visualize the spatial variation of the relative contribution of young and evolved population of stars in the galaxy. The u band flux is negligible in the bar region, which instead is dominant in the region outside the stellar bar and could be hosting intense star formation, which we address in detail using UV data.
M 95 was observed in far-ultraviolet (FUV; λeff = 1538.6 Å, integration time = 1692.2 s) and near-ultraviolet (NUV; λeff = 2315.7 Å, integration time = 1692.2 s) wavelengths using the NASA GALEX mission (Martin et al. 2005). The GALEX FUV channel imaging is at ∼4.2″ and the NUV channel imaging is at 5.3″ resolution (Morrissey et al. 2007). The FUV image is degraded to NUV resolution by running a Gaussian 2D kernel of width 0.57″. The GALEX GR6/GR7 data of M 95 field observed as part of Nearby Galaxy Survey (NGS) is pipeline reduced (with good photometric quality) and astrometry calibrated. We studied the UV properties of this galaxy to probe recent star formation (past a few 100 Myr, Kennicutt & Evans 2012) over scales of ∼288 pc. The HI map of M 95 from The HI Nearby Galaxy Survey (THINGS; Walter et al. 2008) and the CO map (J2 − 1 transition) from CO measured by HERA CO-Line Extragalactic Survey and Berkeley-Illinois-Maryland Association Survey of Nearby Galaxies (HERACLES; Leroy et al. 2009) were used to understand the gas distribution. We used the infrared image from Spitzer IRAC 3.6 μ channel observed as part of S4G (Sheth et al. 2010) to understand the distribution of evolved stellar population in the bar region of the galaxy.
The foreground extinction from the Milky Way galaxy in the direction of M 95 is AV = 0.0762 (Schlegel et al. 1998), which we scaled to the FUV and NUV λmean values using the Cardelli et al. (1989) extinction law; we then corrected the magnitudes The region of the FUV and NUV images that correspond to M 95 was isolated using the threshold set by the background counts from the whole image. We selected pixels with values above the 3σ of the threshold to isolate the galaxy. The counts in the selected pixels were background subtracted, integration time weighted, and converted to magnitude units using the zero-points of Morrissey et al. (2007). We used the magnitudes for each pixel to compute the FUV–NUV colour map of the galaxy (see Fig. 2). The pixels are colour coded in units of FUV–NUV colour. The image is of size ∼8′×8′ and corresponds to a physical size of ∼24 kpc on each side at the rest-frame of the galaxy. The FUV–NUV colour map of M 95 displays a redder region at the centre (with an embedded small blue clump), which is separated from the rest of the galaxy by a region with negligible UV flux. The redder region in Fig. 2 coincides with the major axis of the bar of M 95. It is interesting to note that the bar region has negligible UV flux. This region also coincides with the region identified to be devoid of emission in Hα (James et al. 2009).
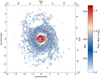 |
Fig. 2. FUV-NUV colour map of the main body of M 95. The pixels are colour-coded in units of FUV-NUV colour. The corresponding SSP equivalent ages are also noted in the colour bar. The contour shows the stellar bar detected from the Spitzer IRAC 3.6 μ image of M 95 with a length ∼4.2 kpc. The image measures ∼8′×8′ and corresponds to a physical size of ∼24 kpc on each side. |
The FUV–NUV colour map can be used to understand the star formation history of M 95 and can, in particular, offer insights into the last burst of star formation. We used the Starburst99 stellar synthesis code to characterize the age of the underlying stellar population in M 95 (Leitherer et al. 1999). We selected 19 single stellar population (SSP) models in an age range of 1–900 Myr assuming a Kroupa IMF (Kroupa 2001) and solar metallicity (Z = 0.02). The synthetic spectral energy distribution for a given age was then convolved with the effective area of the FUV and NUV passbands to compute the expected fluxes. We then used the estimated values to calculate the SSP ages corresponding to the observed FUV–NUV colours. We performed a linear interpolation for the observed colour value and estimated the corresponding ages in all pixels in the FUV–NUV colour map. The ages for the FUV–NUV colour is shown in the colour bar in Fig. 2. This exercise shows that the region along the major axis of the bar hosts stellar populations of age ≥350 Myr and the nuclear/central sub-kiloparsec region shows an embedded bluer, younger clump of star formation (∼150–250 Myr). Figure 3 shows an azimuthally averaged colour profile of M 95. The FUV–NUV colour has been measured in concentric annuli of width 6″ (∼0.3 kpc). We note the striking change in the colour profile moving outwards, where the colour changes from blue to redder values in the very central region and finally to progressively bluer colours with increasing distance from the galaxy centre. There is a slight change to redder colours from 1′ to 1.5′ away from the centre of the galaxy. This is the region on the galaxy where the stellar bar meets the outer star-forming region and hosts dust lanes as seen in optical colour-composite image (Fig. 1). The FUV and NUV flux is subjected to extinction at the rest-frame of the galaxy. We do not have a proper extinction map of the galaxy M 95. The FUV–NUV pixel colour maps and the derived ages can therefore be considered as the upper limits of the actual values.
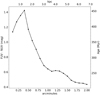 |
Fig. 3. Azimuthally averaged FUV–NUV colour profile of M 95. The 2′ (∼6 kpc) region of the galaxy been averaged in colour in concentric annuli of width 6″. The profile shows an inner blue region gradually changing to redder colours, followed by a change to blue colours. The FUV–NUV colour values and the corresponding age estimates are shown on the left and right axes, respectively. |
The Spitzer IRAC 3.6 μ image of a galaxy can be used as a extinction-free tracer for the evolved stellar population, which dominates the underlying stellar mass (Meidt et al. 2014). The Spitzer IRAC 3.6 μ image of M 95 is shown in Fig. 4 with appropriate scaling to enhance the appearance of the stellar bar. We note that the stellar bar is prominent in the infrared image and could be hosting evolved stellar population. The length of the stellar bar from the infrared image is ∼87″ (∼4.2 Kpc). The HI contours (black colour) and CO contours (yellow colour) are overlaid over the Spitzer image. Comparing Figs. 2 and 4, it is interesting to see that the 4.2 kpc diameter circular region, i.e. the length covered by stellar bar, avoiding the central nuclear region, lacks molecular/neutral hydrogen and star formation. The central sub-kiloparsec nuclear region of the galaxy hosts significant molecular gas content, star formation, and some amount of neutral hydrogen.
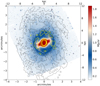 |
Fig. 4. Spitzer IRAC 3.6 μ image (flux unit (MJy sr−1)) of Messier 95 with the black contour demarcating stellar bar detected with a length ∼4.2 kpc. The HI contour (black colour) from THINGS (levels −0.66,20.22,41.10,61.99,82.87 in flux unit (Jy beam−1 s−1)) and the CO contour (yellow colour) from HERACLES (levels −1.65, 2.27 in flux unit (K Km s−1)) are overlaid. There is an offset between the HI and CO emission peak at the centre of the galaxy. The colour scale is adjusted such that the stellar bar feature is prominently seen in the IRAC 3.6 μ image. |
3. Discussion
The stellar bar can channel the gas inwards of the central regions of the galaxy within which star formation can happen and is proposed to be responsible for the formation of pseudo-bulge (Sanders & Huntley 1976; Roberts et al. 1979; Athanassoula 1992; Ho et al. 1997; Kormendy & Kennicutt 2004; Jogee et al. 2005; Lin et al. 2017; Spinoso et al. 2017). On the other hand the bar can also suppress recent star formation in galaxy discs (James & Percival 2016, 2018; Spinoso et al. 2017). Recent simulations demonstrate that the stellar bar to be efficient in quenching star formation with a reduction in star formation rate by a factor of ten in less than 1 Gyr (Khoperskov et al. 2018). These simulations also predict stellar bars as long-lived features in isolated disc galaxies with lifetimes up to ∼1000 Myr (Athanassoula et al. 2013). This implies that stellar bars can keep the galaxy quenched for at least 109 yr and could be a dominant mechanism in shutting down star formation in galaxies over all redshift. It is therefore necessary to have a detailed understanding of the processes operating during the bar quenching in galaxies.
There are primarily two mechanisms suggested for the quenching of star formation due to the effect of bars. The stellar bar in the galaxy can either stabilize the disc against collapse, inhibiting star formation (Tubbs 1982; Reynaud & Downes 1998; Verley et al. 2007; Haywood et al. 2016; Khoperskov et al. 2018), or efficiently consume all the available gas, leaving no fuel for further star formation (Combes & Gerin 1985; Spinoso et al. 2017 ). The turbulence set by the bar prevents the fragmentation of molecular gas within the co-rotation radius and thus suppresses star formation in the bar region of the galaxy. In such a scenario the gas in the bar region of the galaxy need not be depleted nor redistributed to quench star formation. The presence, or alternatively, the absence of the neutral and molecular hydrogen in the quenched barred galaxies can provide insight into the mechanisms responsible for bar quenching. We note that in the scenario where the suppression of star formation is due to bar-induced turbulence, it is not clear whether all the gas will be shock heated. Signatures of shock heating should be seen in Hα observations.
The multiwavelength study of M 95 based on the archival data ranging from UV, optical, infrared, neutral hydrogen, and molecular hydrogen, as traced by CO, paint a picture of star formation quenching happening in the bar region. There is no star formation in the last 100–200 Myr as evident from the FUV–NUV colour map. The lack of molecular and neutral hydrogen in this region implies that the stellar bar might have redistributed the gas. The stellar bar can funnel the gas to the centre and can be the reason for significant molecular gas content and recent star formation observed in the central sub-kiloparsec nucelar/central region. This can lead to nuclear starbursts and formation of substructures (such as circumnuclear rings). M 95 is known to have such features (Colina et al. 1997; Ma et al. 2018). We note that the barred galaxies are demonstrated to have an enhanced star formation at the centre (Ellison et al. 2011) and in the case of M 95 also it is observed to have younger age clumps (∼150–250 Myr). This funneling of gas to the central sub-kiloparsec region would have depleted gas in the bar region and hence suppressed star formation due to lack of fuel. On the other hand, there is significant neutral hydrogen present outside the length of the bar along with the presence of a young stellar population.
The absence of CO and HI in the bar region of M 95 can be considered as a support to the scenario of gas redistribution. The scenario of gas heating due to the stabilization of the disc by bar-induced torques can prevent gas cooling, which in turn can inhibit star formation. However we expect to see the signature of such a gas heating in the form of significant Hα emission, which is lacking along the stellar bar (within the detection limits) in the case of M 95 as demonstrated by the Hα imaging observations of James et al. (2009); see also James & Percival (2015) in which a diffuse emission in Hα and [NII] 6584 Å is attributed to p-AGB stars but shocks are not completely ruled out.
We present evidence for gas redistribution due to the stellar bar and subsequent star formation quenching within the bar co-rotation radius in M 95. The main result of our analysis is a region, between the nuclear region and the ends of the bar, devoid of gas and star formation in the past a few 100 Myr. Star formation is quenched in this region and the absence of molecular/neutral hydrogen gas implies no further star formation is possible or, in other words, bar quenching is a dominant star formation suppression mechanism in M 95. In the absence of an external supply of gas, the star formation in the centre depletes the molecular hydrogen completely and the galaxy is eventually devoid of star formation in the bar and central nuclear region.
It is not clear whether bar quenching is the dominant process responsible for star formation suppression in barred spiral galaxies in general and the redistribution of the gas due to stellar bar is the main governing process. The pilot study reported in this work demonstrates the capability of multiwavelength analysis in understanding the role of stellar bar in star formation progression and gas distribution in spiral galaxies. The results presented call for a detailed analysis of a statistically large sample of face-on barred galaxies with multiwavelength observations, which will be reported in a forthcoming paper. The stellar and gaseous kinematics (ionized gas) along the bar region can be understood in more detail from the observations based on ongoing optical integral field unit surveys.
4. Summary
We present observational evidence for star formation quenching due to the presence of a stellar bar and the mechanism responsible for quenching in galaxy Messier 95 based on a multiwavelength analysis using the archival data. Based on the FUV–NUV pixel colour map we demonstrate that the central 4.2 kpc diameter region along the stellar bar of galaxy is composed of stellar population with equivalent ages ≥350 Myr. This implies that currently there is no ongoing star formation along the region covered by the bar. The central sub-kiloparsec region of the galaxy hosts an abundant supply of molecular hydrogen with the region along the bar devoid of neutral and molecular hydrogen, but is present outside the stellar bar region. This is a direct evidence coming from observations for the stellar bar in Messier 95 dynamically redistributing the gas, making the region close to the bar devoid of fuel for star formation. A similar analysis along with a spatially resolved study of the gaseous and stellar kinematics on a statistically significant number of barred galaxies can give more insight into bar quenching in spiral galaxies.
α(J2000) = 10:43:57.7 and δ(J2000) = +11:42:14 according to Nasa/IPAC Extragalactic Database (NED).
NED.
Acknowledgments
We thank the anonymous referee for comments that improved the scientific content of the paper. KG acknowledges the stimulating discussion within the GASP collaboration on stellar bars in galaxies. SS acknowledges support from the Science and Engineering Research Board, India through a Ramanujan Fellowship. This work made use of THINGS, “The HI Nearby Galaxy Survey” (Walter et al. 2008). This work made use of HERACLES, “The HERA CO-Line Extragalactic Survey” (Leroy et al. 2009). This research made use of Astropy, a community-developed core Python package for Astronomy (Astropy Collaboration 2018). Funding for SDSS-III has been provided by the Alfred P. Sloan Foundation, the Participating Institutions, the National Science Foundation, and the US Department of Energy Office of Science. The SDSS-III website is http://www.sdss3.org/. SDSS-III is managed by the Astrophysical Research Consortium for the Participating Institutions of the SDSS-III Collaboration including the University of Arizona, the Brazilian Participation Group, Brookhaven National Laboratory, Carnegie Mellon University, University of Florida, the French Participation Group, the German Participation Group, Harvard University, the Instituto de Astrofisica de Canarias, the Michigan State/Notre Dame/JINA Participation Group, Johns Hopkins University, Lawrence Berkeley National Laboratory, Max Planck Institute for Astrophysics, Max Planck Institute for Extraterrestrial Physics, New Mexico State University, New York University, Ohio State University, Pennsylvania State University, University of Portsmouth, Princeton University, the Spanish Participation Group, University of Tokyo, University of Utah, Vanderbilt University, University of Virginia, University of Washington, and Yale University.
References
- Ahn, C. P., Alexandroff, R., Allende Prieto, C., et al. 2012, ApJS, 203, 21 [NASA ADS] [CrossRef] [Google Scholar]
- Astropy Collaboration (Price-Whelan, A. M., et al.) 2018, AJ, 156, 123 [Google Scholar]
- Athanassoula, E. 1992, MNRAS, 259, 345 [NASA ADS] [CrossRef] [Google Scholar]
- Athanassoula, E., Machado, R. E. G., & Rodionov, S. A. 2013, MNRAS, 429, 1949 [NASA ADS] [CrossRef] [Google Scholar]
- Baldry, I. K., Glazebrook, K., Brinkmann, J., et al. 2004, ApJ, 600, 681 [NASA ADS] [CrossRef] [Google Scholar]
- Bell, E. F., Wolf, C., Meisenheimer, K., et al. 2004, ApJ, 608, 752 [NASA ADS] [CrossRef] [Google Scholar]
- Bresolin, F., & Kennicutt, R. C. 2002, ApJ, 572, 838 [NASA ADS] [CrossRef] [Google Scholar]
- Cardelli, J. A., Clayton, G. C., & Mathis, J. S. 1989, ApJ, 345, 245 [NASA ADS] [CrossRef] [Google Scholar]
- Cheung, E., Athanassoula, E., Masters, K. L., et al. 2013, ApJ, 779, 162 [NASA ADS] [CrossRef] [Google Scholar]
- Coelho, P., & Gadotti, D. A. 2011, ApJ, 743, 13 [NASA ADS] [CrossRef] [Google Scholar]
- Combes, F., & Gerin, M. 1985, A&A, 150, 327 [NASA ADS] [Google Scholar]
- Combes, F., & Sanders, R. H. 1981, A&A, 96, 164 [NASA ADS] [Google Scholar]
- Combes, F., Debbasch, F., Friedli, D., & Pfenniger, D. 1990, A&A, 233, 82 [NASA ADS] [Google Scholar]
- Colina, L., García Vargas, M. L., Mas-Hesse, J. M., Alberdi, A., & Krabbe, A. 1997, ApJ, 484, 41 [NASA ADS] [CrossRef] [Google Scholar]
- Consolandi, G., Dotti, M., Boselli, A., Gavazzi, G., & Gargiulo, F. 2017, A&A, 598, A114 [NASA ADS] [CrossRef] [EDP Sciences] [Google Scholar]
- Couch, W. J., Barger, A. J., Smail, I., Ellis, R. S., & Sharples, R. M. 1998, ApJ, 497, 188 [NASA ADS] [CrossRef] [Google Scholar]
- Cortese, L., & Hughes, T. M. 2009, MNRAS, 400, 1225 [NASA ADS] [CrossRef] [Google Scholar]
- Debattista, V. P., Carollo, C. M., Mayer, L., & Moore, B. 2004, ApJ, 604, L93 [NASA ADS] [CrossRef] [Google Scholar]
- Deng, X.-F., He, J.-Z., Wu, P., & Ding, Y.-P. 2009, ApJ, 699, 948 [NASA ADS] [CrossRef] [Google Scholar]
- Dressler, A., Smail, I., Poggianti, B. M., et al. 1999, ApJS, 122, 51 [NASA ADS] [CrossRef] [Google Scholar]
- Ellison, S. L., Nair, P., Patton, D. R., et al. 2011, MNRAS, 416, 2182 [NASA ADS] [CrossRef] [Google Scholar]
- Elmegreen, D. M., Chromey, F. R., Santos, M., & Marshall, D. 1997, AJ, 114, 1850 [NASA ADS] [CrossRef] [Google Scholar]
- Faber, S. M., Willmer, C. N. A., Wolf, C., et al. 2007, ApJ, 665, 265 [NASA ADS] [CrossRef] [Google Scholar]
- Fraser-McKelvie, A., Brown, M. J. I., Pimbblet, K. A., et al. 2016, MNRAS, 462, L11 [NASA ADS] [CrossRef] [Google Scholar]
- Freedman, W. L., Madore, B. F., Gibson, B. K., et al. 2001, ApJ, 553, 47 [NASA ADS] [CrossRef] [Google Scholar]
- Gavazzi, G., Consolandi, G., Dotti, M., et al. 2015, A&A, 580, A116 [NASA ADS] [CrossRef] [EDP Sciences] [Google Scholar]
- Hakobyan, A. A., Karapetyan, A. G., Barkhudaryan, L. V., et al. 2016, MNRAS, 456, 2848 [NASA ADS] [CrossRef] [Google Scholar]
- Haywood, M., Lehnert, M. D., Di Matteo, P., et al. 2016, A&A, 589, A66 [NASA ADS] [CrossRef] [EDP Sciences] [PubMed] [Google Scholar]
- Ho, L. C., Filippenko, A. V., & Sargent, W. L. W. 1997, ApJ, 487, 591 [NASA ADS] [CrossRef] [Google Scholar]
- James, P. A., & Percival, S. M. 2015, MNRAS, 450, 3503 [NASA ADS] [CrossRef] [Google Scholar]
- James, P. A., & Percival, S. M. 2016, MNRAS, 457, 917 [NASA ADS] [CrossRef] [Google Scholar]
- James, P. A., & Percival, S. M. 2018, MNRAS, 474, 3101 [NASA ADS] [CrossRef] [Google Scholar]
- James, P. A., Bretherton, C. F., & Knapen, J. H. 2009, A&A, 501, 207 [NASA ADS] [CrossRef] [EDP Sciences] [Google Scholar]
- Jogee, S., Scoville, N., & Kenney, J. D. P. 2005, ApJ, 630, 837 [NASA ADS] [CrossRef] [Google Scholar]
- Kennicutt, R. C., & Evans, N. J. 2012, ARA&A, 50, 531 [NASA ADS] [CrossRef] [Google Scholar]
- Khoperskov, S., Haywood, M., Di Matteo, P., Lehnert, M. D., & Combes, F. 2018, A&A, 609, A60 [NASA ADS] [CrossRef] [EDP Sciences] [Google Scholar]
- Kim, E., Hwang, H. S., Chung, H., et al. 2017, ApJ, 845, 93 [NASA ADS] [CrossRef] [Google Scholar]
- Komatsu, E., Smith, K. M., Dunkley, J., et al. 2011, ApJS, 192, 18 [NASA ADS] [CrossRef] [Google Scholar]
- Kormendy, J., & Kennicutt, Jr., R. C. 2004, ARA&A, 42, 603 [NASA ADS] [CrossRef] [Google Scholar]
- Kroupa, P. 2001, MNRAS, 322, 231 [NASA ADS] [CrossRef] [Google Scholar]
- Lee, J. H., Lee, M. G., Park, C., & Choi, Y.-Y. 2008, MNRAS, 389, 1791 [NASA ADS] [CrossRef] [Google Scholar]
- Leitherer, C., Schaerer, D., Goldader, J. D., et al. 1999, ApJS, 123, 3 [NASA ADS] [CrossRef] [Google Scholar]
- Lin, L., Li, C., He, Y., Xiao, T., & Wang, E. 2017, ApJ, 838, 105 [NASA ADS] [CrossRef] [Google Scholar]
- Leroy, A. K., Walter, F., Brinks, E., et al. 2008, AJ, 136, 2782 [NASA ADS] [CrossRef] [Google Scholar]
- Leroy, A. K., Walter, F., Bigiel, F., et al. 2009, AJ, 137, 4670 [NASA ADS] [CrossRef] [Google Scholar]
- Ma, C., de Grijs, R., & Ho, L. C. 2018, ApJ, 857, 116 [NASA ADS] [CrossRef] [Google Scholar]
- Man, A., & Belli, S. 2018, Nat. Astron., 2, 695 [NASA ADS] [CrossRef] [Google Scholar]
- Martin, D. C., Fanson, J., Schiminovich, D., et al. 2005, ApJ, 619, L1 [Google Scholar]
- Martinet, L., & Friedli, D. 1997, A&A, 323, 363 [NASA ADS] [Google Scholar]
- Masters, K. L., Mosleh, M., Romer, A. K., et al. 2010, MNRAS, 405, 783 [NASA ADS] [Google Scholar]
- Masters, K. L., Nichol, R. C., Hoyle, B., et al. 2011, MNRAS, 411, 2026 [NASA ADS] [CrossRef] [Google Scholar]
- Masters, K. L., Nichol, R. C., Haynes, M. P., et al. 2012, MNRAS, 424, 2180 [NASA ADS] [CrossRef] [Google Scholar]
- Mazzalay, X., Saglia, R. P., Erwin, P., et al. 2013, MNRAS, 428, 2389 [NASA ADS] [CrossRef] [Google Scholar]
- Meidt, S. E., Schinnerer, E., van de Ven, G., et al. 2014, ApJ, 788, 144 [NASA ADS] [CrossRef] [Google Scholar]
- Morrissey, P., Conrow, T., Barlow, T. A., et al. 2007, ApJS, 173, 682 [NASA ADS] [CrossRef] [Google Scholar]
- Oh, S., Oh, K., & Yi, S. K. 2012, ApJS, 198, 4 [Google Scholar]
- Peng, Y., Maiolino, R., & Cochrane, R. 2015, Nature, 521, 192 [NASA ADS] [CrossRef] [Google Scholar]
- Planesas, P., Colina, L., & Perez-Olea, D. 1997, A&A, 325, 81 [NASA ADS] [Google Scholar]
- Poggianti, B. M., Smail, I., Dressler, A., et al. 1999, ApJ, 518, 576 [NASA ADS] [CrossRef] [Google Scholar]
- Reynaud, D., & Downes, D. 1998, A&A, 337, 671 [NASA ADS] [Google Scholar]
- Rémy-Ruyer, A., Madden, S. C., Galliano, F., et al. 2014, A&A, 563, A31 [NASA ADS] [CrossRef] [EDP Sciences] [Google Scholar]
- Roberts, Jr., W. W., Huntley, J. M., & van Albada, G. D. 1979, ApJ, 233, 67 [NASA ADS] [CrossRef] [Google Scholar]
- Sanders, R. H., & Huntley, J. M. 1976, ApJ, 209, 53 [NASA ADS] [CrossRef] [Google Scholar]
- Schawinski, K., Lintott, C., Thomas, D., et al. 2009, MNRAS, 396, 818 [NASA ADS] [CrossRef] [Google Scholar]
- Sheth, K., Volgel, S. N., Regan, M. W., Thornley, M. D., & Teuben, P. J. 2005, ApJ, 632, 217 [NASA ADS] [CrossRef] [Google Scholar]
- Sheth, K., Regan, M., Hinz, J. L., et al. 2010, PASP, 122, 1397 [NASA ADS] [CrossRef] [Google Scholar]
- Schlegel, D. J., Finkbeiner, D. P., & Davis, M. 1998, ApJ, 500, 525 [NASA ADS] [CrossRef] [Google Scholar]
- Spinoso, D., Bonoli, S., Dotti, M., et al. 2017, MNRAS, 465, 3729 [NASA ADS] [CrossRef] [Google Scholar]
- Strateva, I., Ivezić, Ž., Knapp, G. R., et al. 2001, AJ, 122, 1861 [Google Scholar]
- Swartz, D. A., Yukita, M., Tennant, A. F., Soria, R., & Ghosh, K. K. 2006, ApJ, 647, 1030 [NASA ADS] [CrossRef] [Google Scholar]
- Tubbs, A. D. 1982, ApJ, 255, 458 [NASA ADS] [CrossRef] [Google Scholar]
- van den Bergh, S. 1976, ApJ, 206, 883 [NASA ADS] [CrossRef] [Google Scholar]
- Verley, S., Combes, F., Verdes-Montenegro, L., Bergond, G., & Leon, S. 2007, A&A, 474, 43 [NASA ADS] [CrossRef] [EDP Sciences] [Google Scholar]
- Walter, F., Brinks, E., de Blok, W. J. G., et al. 2008, AJ, 136, 2563 [NASA ADS] [CrossRef] [Google Scholar]
All Figures
|
Fig. 1. Colour composite created from SDSS urz filter passband images of M 95. The RGB image is created by assigning red (z−band), green (r−band), and blue (u−band) colours to the filter pass band images. The dust lane along the bar is seen in the colour-composite image. |
| In the text | |
|
Fig. 2. FUV-NUV colour map of the main body of M 95. The pixels are colour-coded in units of FUV-NUV colour. The corresponding SSP equivalent ages are also noted in the colour bar. The contour shows the stellar bar detected from the Spitzer IRAC 3.6 μ image of M 95 with a length ∼4.2 kpc. The image measures ∼8′×8′ and corresponds to a physical size of ∼24 kpc on each side. |
| In the text | |
|
Fig. 3. Azimuthally averaged FUV–NUV colour profile of M 95. The 2′ (∼6 kpc) region of the galaxy been averaged in colour in concentric annuli of width 6″. The profile shows an inner blue region gradually changing to redder colours, followed by a change to blue colours. The FUV–NUV colour values and the corresponding age estimates are shown on the left and right axes, respectively. |
| In the text | |
|
Fig. 4. Spitzer IRAC 3.6 μ image (flux unit (MJy sr−1)) of Messier 95 with the black contour demarcating stellar bar detected with a length ∼4.2 kpc. The HI contour (black colour) from THINGS (levels −0.66,20.22,41.10,61.99,82.87 in flux unit (Jy beam−1 s−1)) and the CO contour (yellow colour) from HERACLES (levels −1.65, 2.27 in flux unit (K Km s−1)) are overlaid. There is an offset between the HI and CO emission peak at the centre of the galaxy. The colour scale is adjusted such that the stellar bar feature is prominently seen in the IRAC 3.6 μ image. |
| In the text | |
Current usage metrics show cumulative count of Article Views (full-text article views including HTML views, PDF and ePub downloads, according to the available data) and Abstracts Views on Vision4Press platform.
Data correspond to usage on the plateform after 2015. The current usage metrics is available 48-96 hours after online publication and is updated daily on week days.
Initial download of the metrics may take a while.