Fig. 5
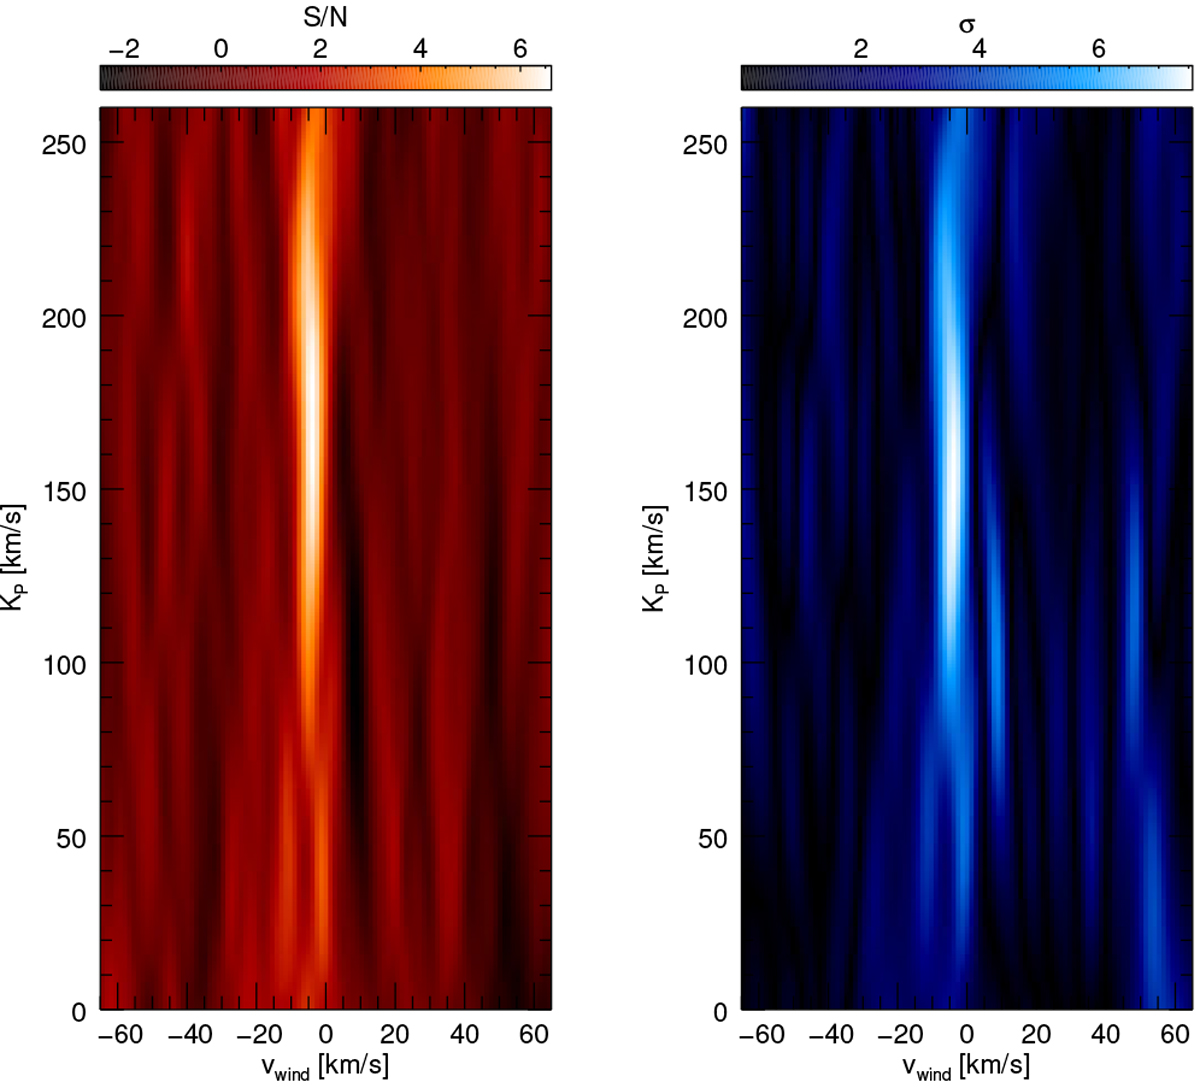
S/N results (left panel) and t-test results (right panel, in sigma units) when cross-correlating, in a wide range of KP and vwind values, the residual matrix and the synthetic absorption model including the p–T profile B anda water vapour content of VMR = 10−4. In both panels, the strongest signals reveal at planet radial velocity semi-amplitudes (KP) compatibles with values in the literature. They also happen at the same wind velocities (vwind), indicating a cross-correlation signal blue-shifted by −3.9 ± 1.3 km s−1. No comparable signals are found close to the expected KP. Neither are there comparable signals at the Earth’s frame (low KP values), discarding the presence of significant telluric contamination.
Current usage metrics show cumulative count of Article Views (full-text article views including HTML views, PDF and ePub downloads, according to the available data) and Abstracts Views on Vision4Press platform.
Data correspond to usage on the plateform after 2015. The current usage metrics is available 48-96 hours after online publication and is updated daily on week days.
Initial download of the metrics may take a while.