Fig. 4
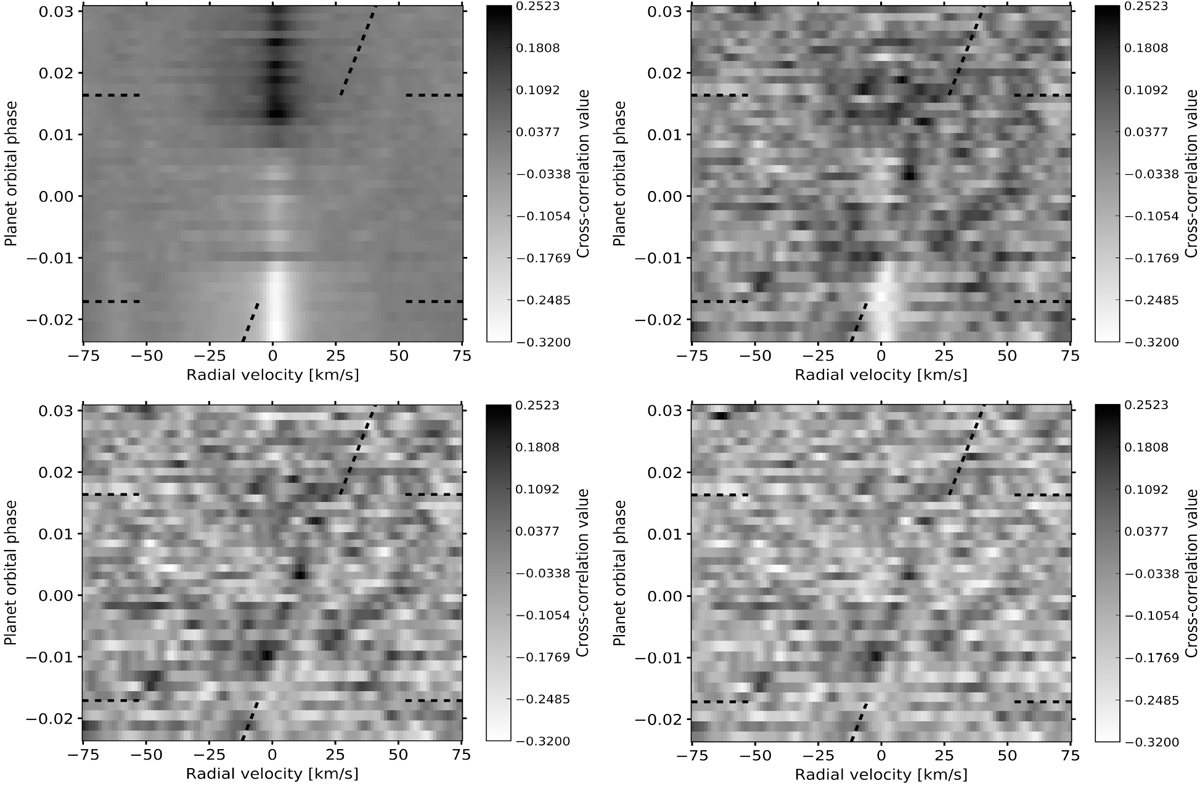
Cross-correlation values as a function of the orbital phase and planet radial velocity with respect to the Earth after one (top left panel), two (top right panel), three (bottom left panel) and ten (bottom right panel) SYSREM iterations. The first and last transit spectra are indicated with horizontal dashed lines. After the first and second iteration of SYSREM the cross correlation with the telluric residuals are visible around the zero velocity. From the third iteration onwards, the suppression of the telluric residuals increases and the planet atmospheric signature is expected along the planetary velocities, indicated with the tilted dashed lines (when vwind = 0 km s−1).
Current usage metrics show cumulative count of Article Views (full-text article views including HTML views, PDF and ePub downloads, according to the available data) and Abstracts Views on Vision4Press platform.
Data correspond to usage on the plateform after 2015. The current usage metrics is available 48-96 hours after online publication and is updated daily on week days.
Initial download of the metrics may take a while.