Free Access
Fig. 3
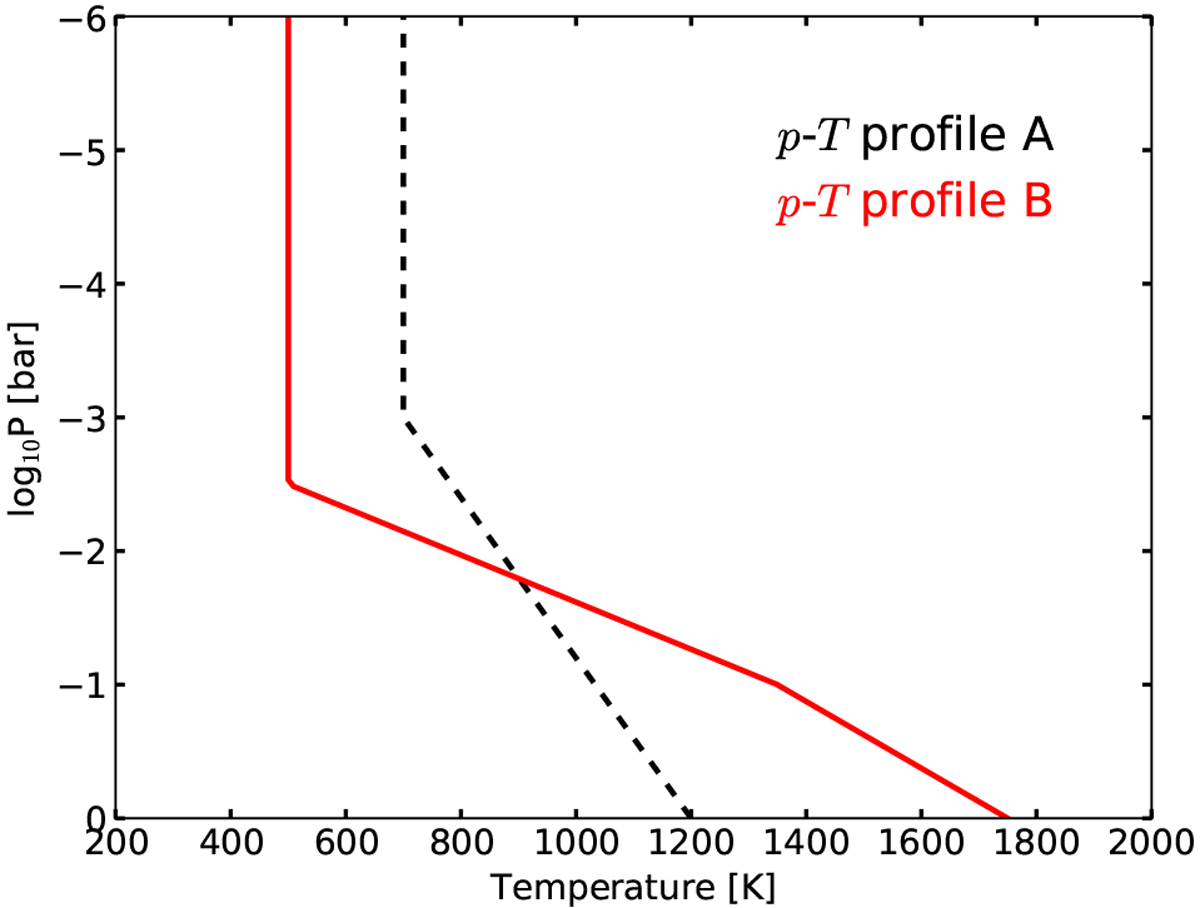
Pressure–temperature (p–T) profiles used for computing the synthetic atmospheric absorption spectra. In dashed black, the p–T profile A, was obtained from our best fit to the HST/WFC3 data of McCullough et al. (2014). In solid red, the p–T profile B was taken from Brogi et al. (2018).
Current usage metrics show cumulative count of Article Views (full-text article views including HTML views, PDF and ePub downloads, according to the available data) and Abstracts Views on Vision4Press platform.
Data correspond to usage on the plateform after 2015. The current usage metrics is available 48-96 hours after online publication and is updated daily on week days.
Initial download of the metrics may take a while.