Fig. 2
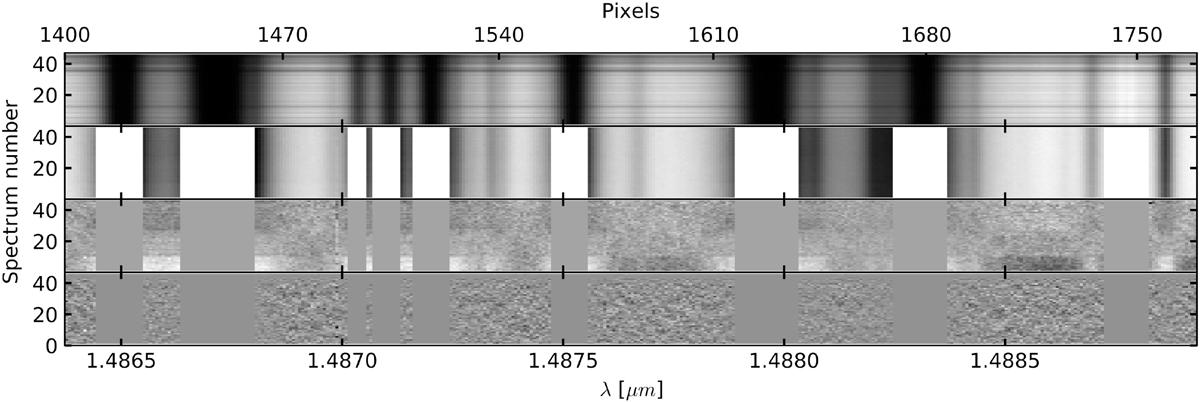
Observed spectra matrices at different steps of the analysis for a short wavelength range in order 41. We plot wavelength along the horizontal axis and the time series of spectra along the vertical axes. Top panel: matrix of spectra as provided by the CARMENES pipeline. Upper middle panel: normalised and masked spectra ready for the telluric and stellar removal process with SYSREM. Bottom middle panel: matrix of residuals after the first iteration. At this point the telluric residuals are still visible. Bottom panel: matrix of residuals after the tenth iteration. The telluric residuals are almost completely removed.
Current usage metrics show cumulative count of Article Views (full-text article views including HTML views, PDF and ePub downloads, according to the available data) and Abstracts Views on Vision4Press platform.
Data correspond to usage on the plateform after 2015. The current usage metrics is available 48-96 hours after online publication and is updated daily on week days.
Initial download of the metrics may take a while.