Fig. 10
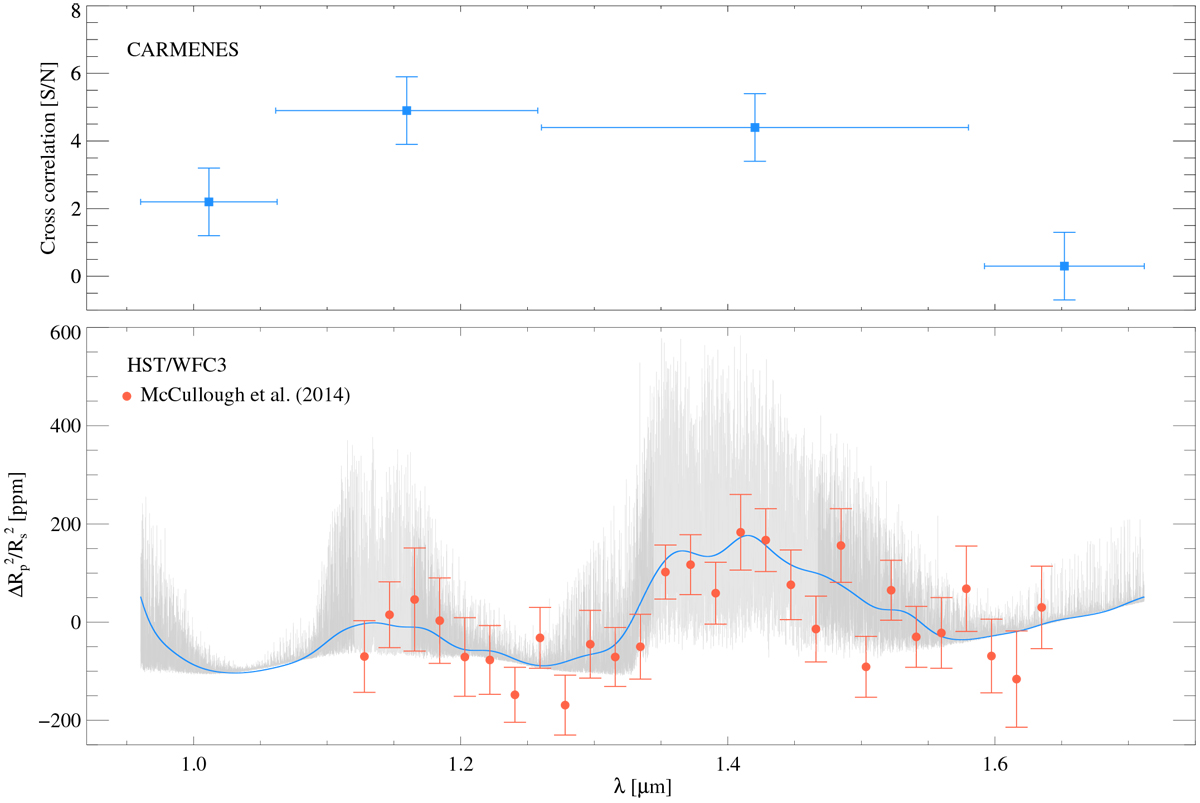
Top panel: S/N values of the CCFs for the four studied bands (see Table. 2). Bottom panel: water vapour absorption spectrum at the CARMENES resolution (in grey) when using the p–T profile A anda water VMR = 10−5, and the same model but Gaussian smoothed to the HST/WFC3 resolution (in blue). The lighter grey areas are the wavelength regions covered by the orders discarded during our analysis. Over-plotted in red are the HST/WFC3 measurements provided by McCullough et al. (2014). We detected the two strongest bands around 1.15 and 1.4 μm. We note that the S/Ns shown in the top panel cannot be directly compared to the HST absorption signals as shown in the bottom panel, since the former depend on the high-frequency component of the transmission spectrum, and are strongly affected by telluric absorption.
Current usage metrics show cumulative count of Article Views (full-text article views including HTML views, PDF and ePub downloads, according to the available data) and Abstracts Views on Vision4Press platform.
Data correspond to usage on the plateform after 2015. The current usage metrics is available 48-96 hours after online publication and is updated daily on week days.
Initial download of the metrics may take a while.