Fig. A.1.
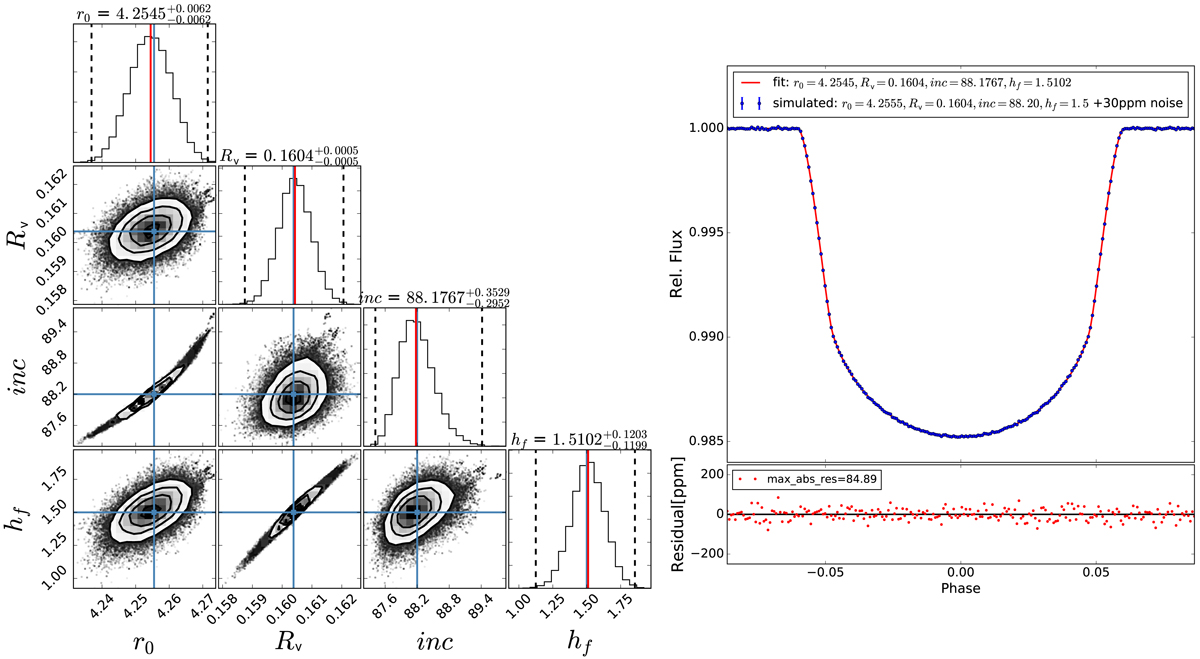
Left panel: posterior distributions for parameters of simulated deformed WASP103b with 30 ppm noise added. The values quoted on the diagonal histograms indicate the median marginalized distribution of each parameter (red lines) with the surrounding 68% credible interval (±1σ). The dashed vertical lines indicate the ±3σ limits calculated as the 0.15th and 99.87th percentiles. Blue lines indicate the true simulated values. Right panel: fit of simulated light curve of ellipsoidal WASP-103b with parameters retrieved from the sampling.
Current usage metrics show cumulative count of Article Views (full-text article views including HTML views, PDF and ePub downloads, according to the available data) and Abstracts Views on Vision4Press platform.
Data correspond to usage on the plateform after 2015. The current usage metrics is available 48-96 hours after online publication and is updated daily on week days.
Initial download of the metrics may take a while.