Free Access
Fig. 6.
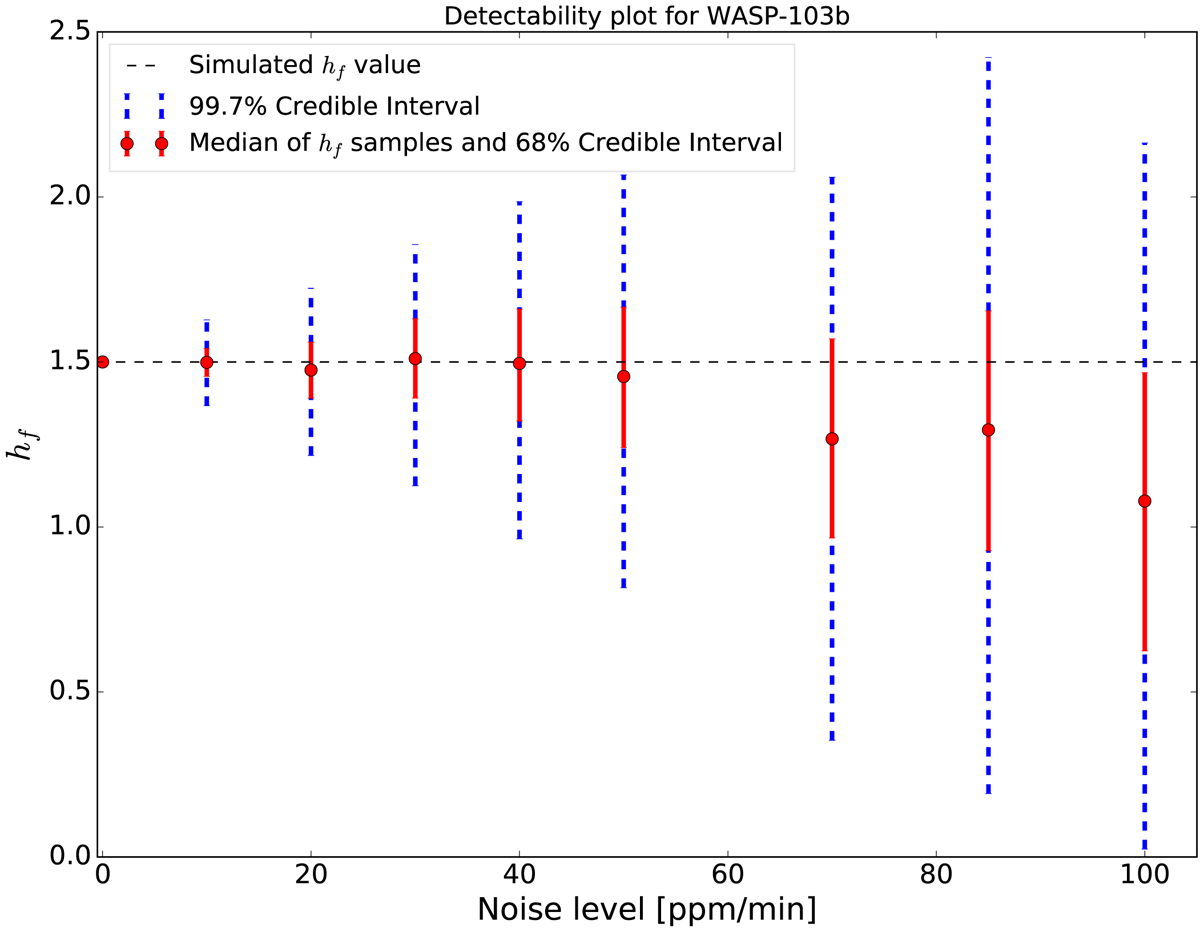
Detectability of deformation in WASP-103b considering different noise levels. The black dashed line is the simulated hf value. The points are the median of the hf samples at each noise level. The red error bars show the 68% credible interval (≃ ± 1σ) while the blue error bars show the 99.7% credible interval (≃ ± 3σ).
Current usage metrics show cumulative count of Article Views (full-text article views including HTML views, PDF and ePub downloads, according to the available data) and Abstracts Views on Vision4Press platform.
Data correspond to usage on the plateform after 2015. The current usage metrics is available 48-96 hours after online publication and is updated daily on week days.
Initial download of the metrics may take a while.