Free Access
Fig. 3
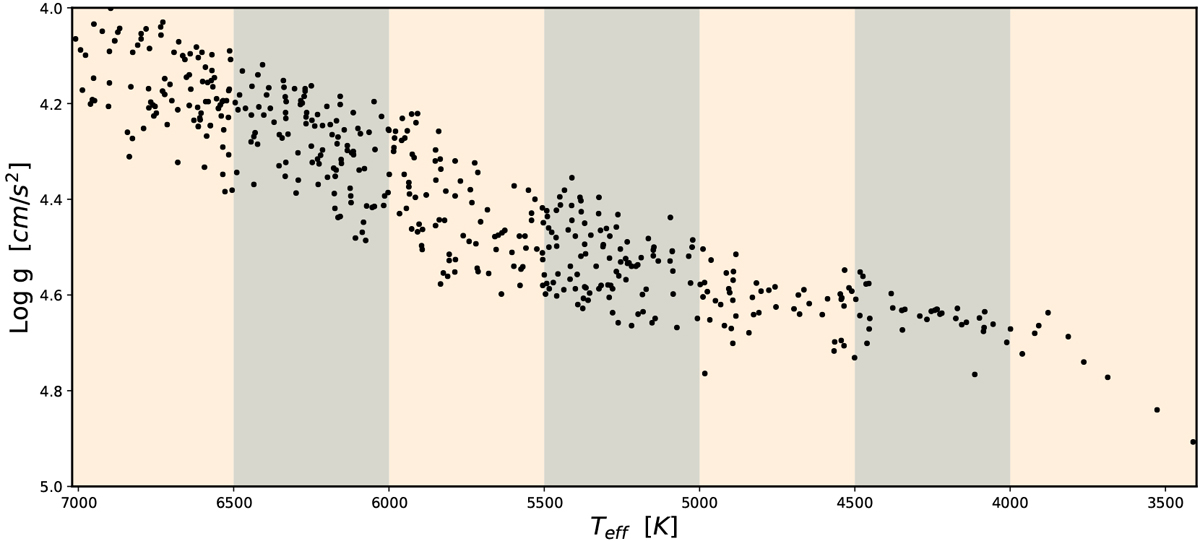
Logarithm of gravity versus effective temperature for the entire sample of stars used in this study, taken from Kepler Input Catalog (KIC; Brown et al. 2011). The different shaded zones correspond to the effective temperature ranges in which the sample has been subdivided.
Current usage metrics show cumulative count of Article Views (full-text article views including HTML views, PDF and ePub downloads, according to the available data) and Abstracts Views on Vision4Press platform.
Data correspond to usage on the plateform after 2015. The current usage metrics is available 48-96 hours after online publication and is updated daily on week days.
Initial download of the metrics may take a while.