Fig. 2
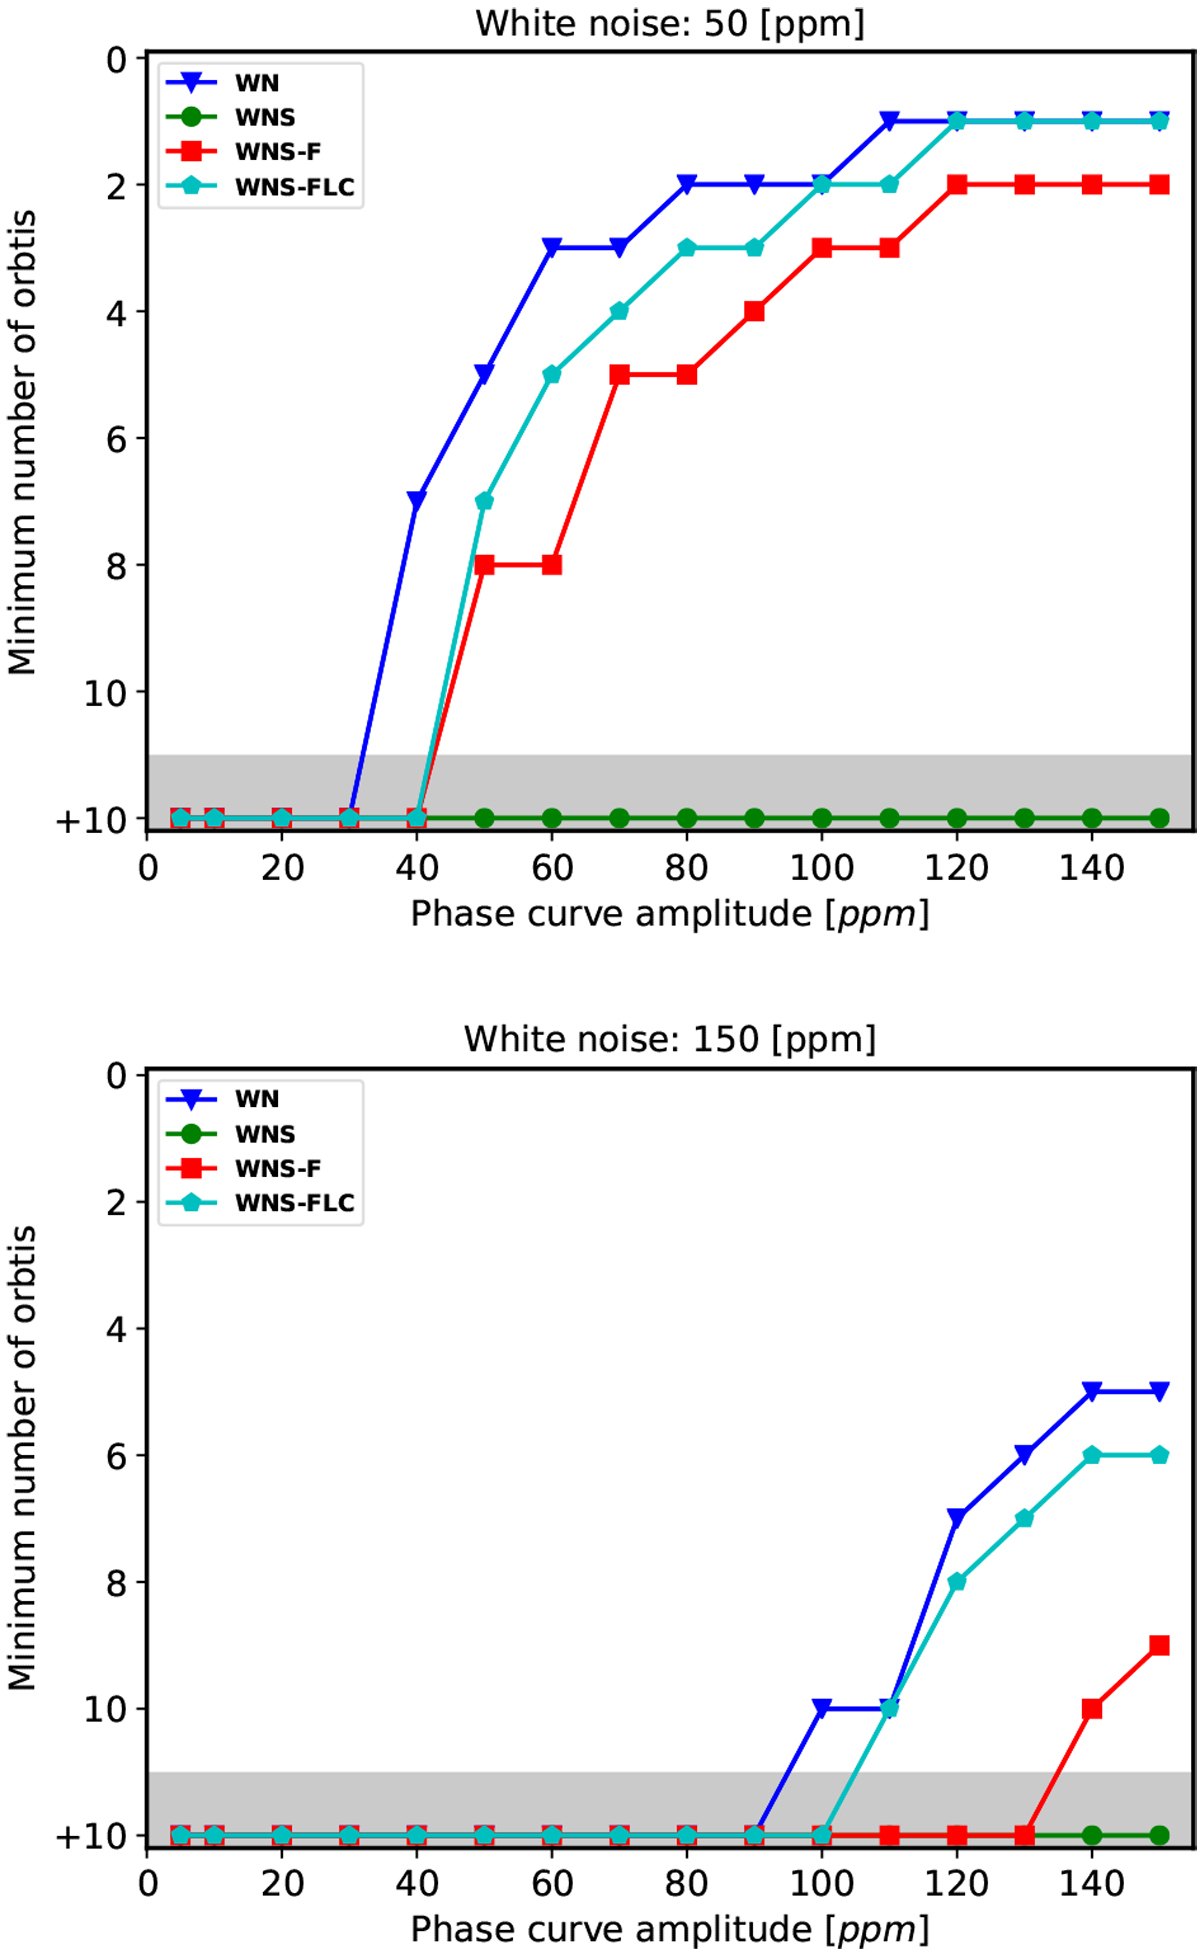
Minimum number of orbits required to have significant phase curve detection. Each of the plots represents an initial white noise level (top panel: 50 ppm, bottom panel: 150 ppm) for a period of 2.5 days. For each of the different white noise curves, four different cases are studied, as explained in Fig. 1. The grey shaded area represents the case where more than 10 orbits (+10) are required to perform a phase curve detection. The plot with an amplitude of 300 ppm is not presented here since it is necessary more than 10 orbits in all cases to detect the phase curve.
Current usage metrics show cumulative count of Article Views (full-text article views including HTML views, PDF and ePub downloads, according to the available data) and Abstracts Views on Vision4Press platform.
Data correspond to usage on the plateform after 2015. The current usage metrics is available 48-96 hours after online publication and is updated daily on week days.
Initial download of the metrics may take a while.